Get the right information, with visual impact, to the people who need it
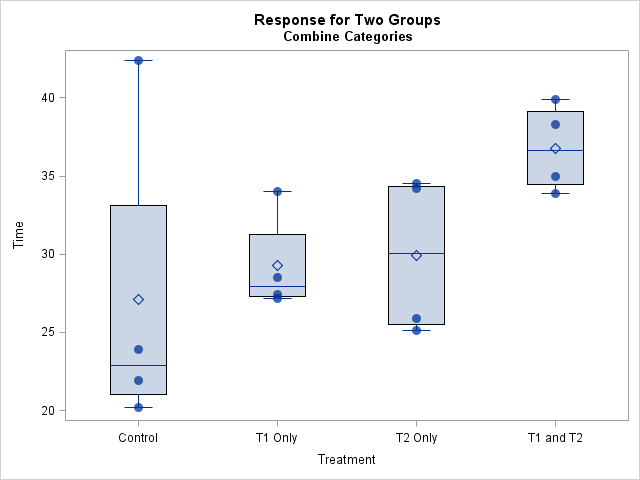
Visualize an ANOVA with two-way interactions

There are several ways to visualize data in a two-way ANOVA model. Most visualizations show a statistical summary of the response variable for each category. However, for small data sets, it can be useful to overlay the raw data. This article shows a simple trick that you can use to