Get the right information, with visual impact, to the people who need it
Advanced ODS Graphics: Range Attribute Maps

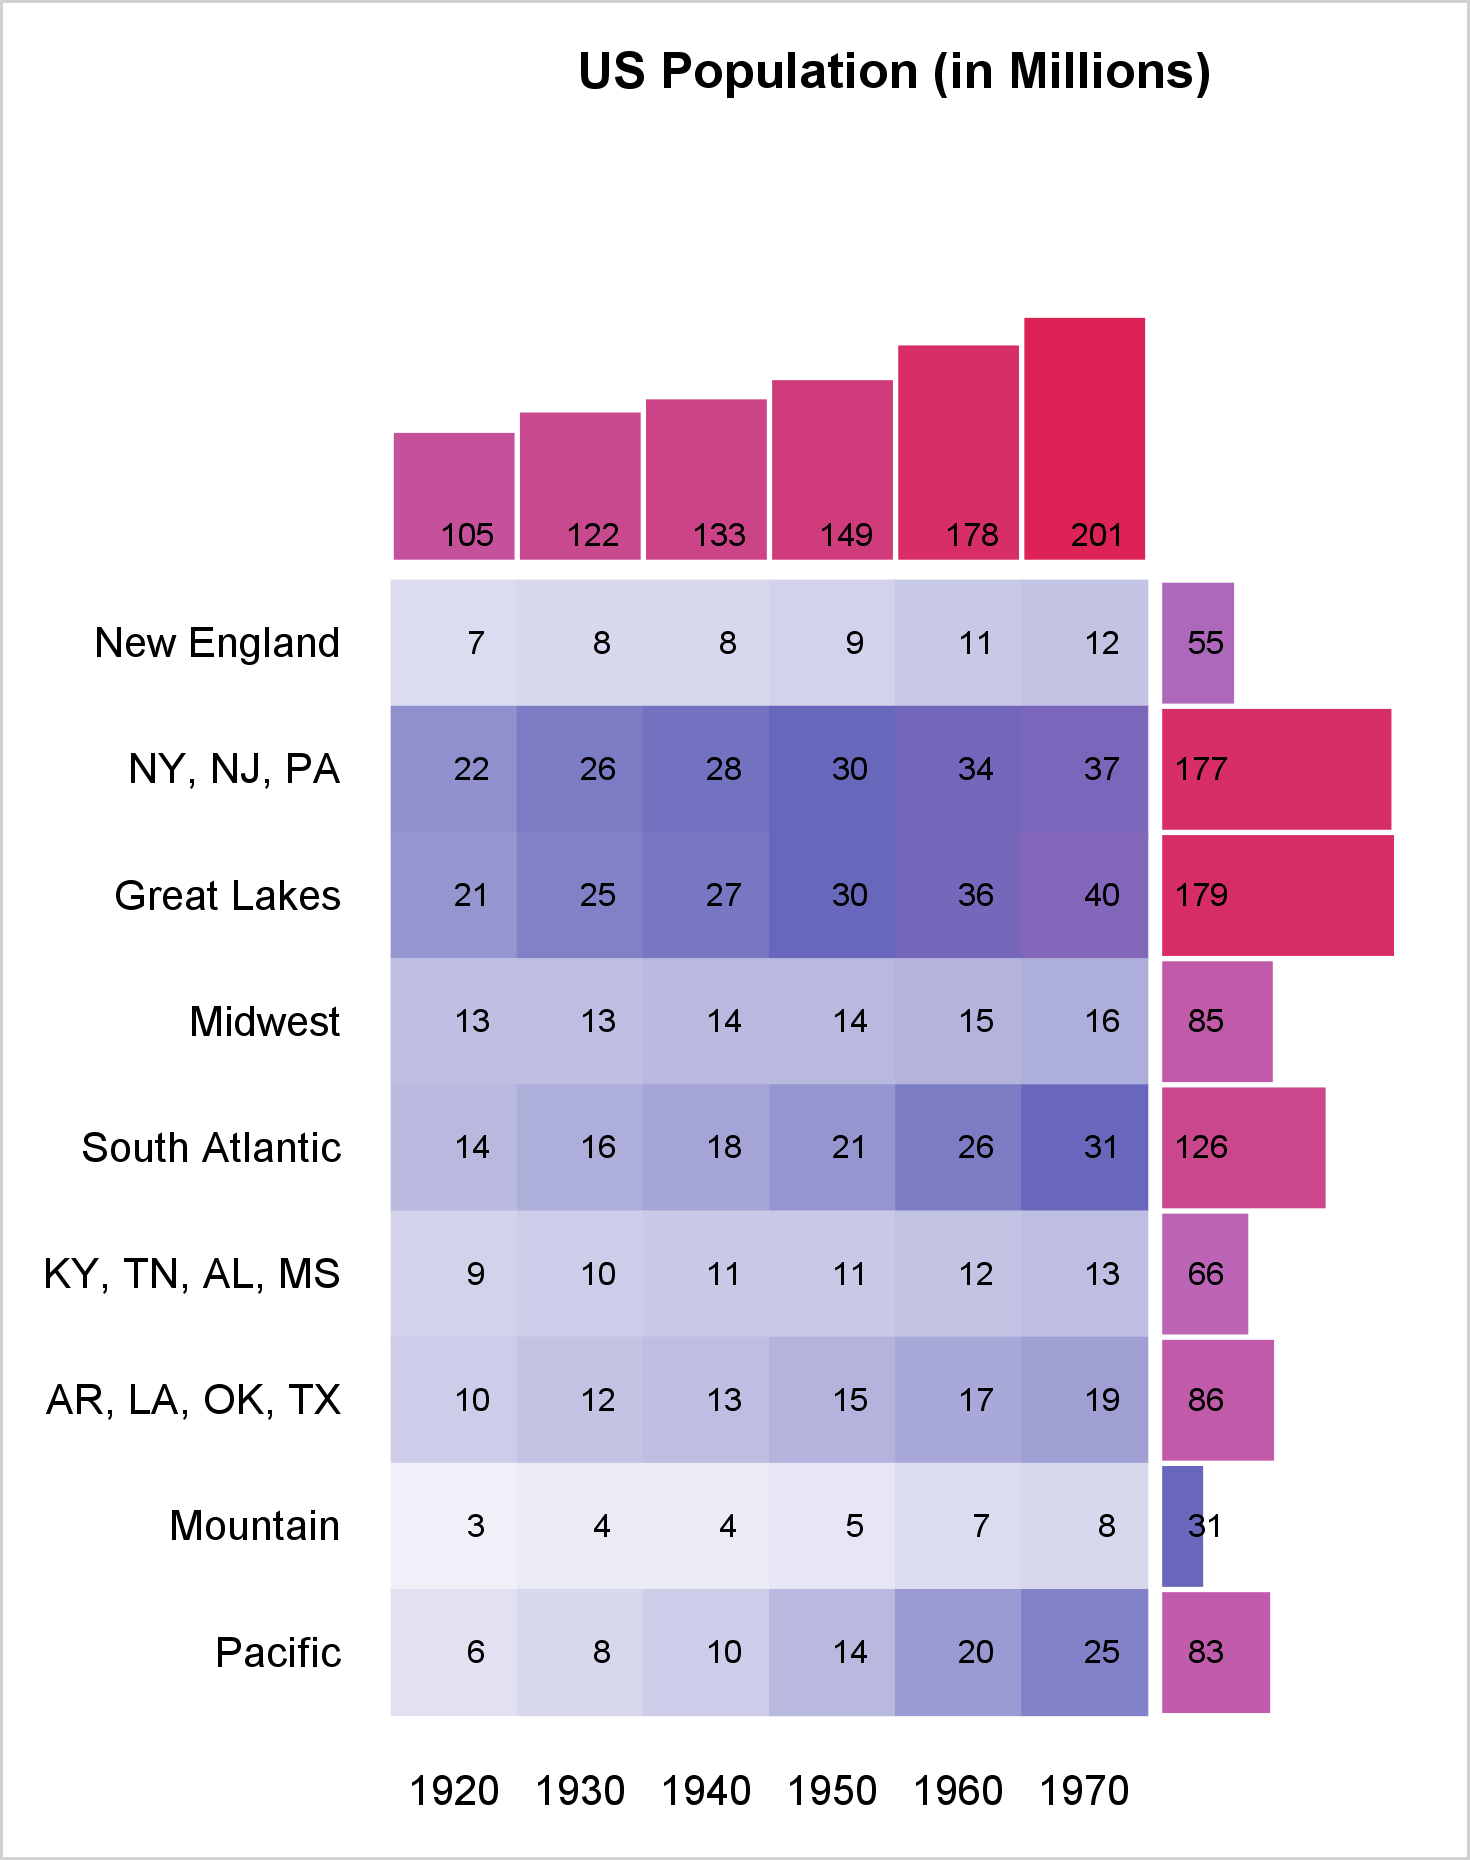
You can use a range attribute map to control the mapping of values in a continuous variable to colors. This post shows you how to use PROC SGPLOT to display multiple plots in the same graph and use range attribute maps.