Get the right information, with visual impact, to the people who need it

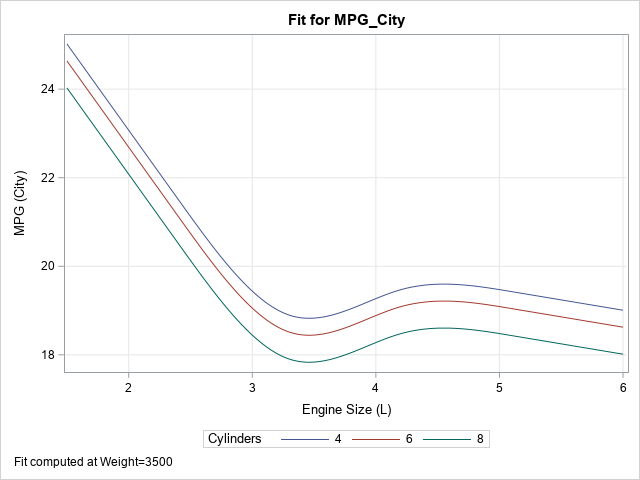
A SAS analyst read my previous article about visualizing the predicted values for a regression model that uses spline effects. Because the original explanatory variable does not appear in the model, the analyst had several questions: How do you score the model on new data? The previous example has only


