I was sitting in a model railroad club meeting when one of our more enthusiastic young members said, "Wouldn't it be cool if we could make a computer simulation, with trains going between stations and all. We could have cars and engines assigned to each train and timetables and…" So,
Tag: tips & tricks
Whether you are a strong believer in the power of dividing by zero, agnostic, undecided, a supporter, denier or anything in between and beyond, this blog post will bring all to a common denominator. History of injustice For how many years have you been told that you cannot divide by
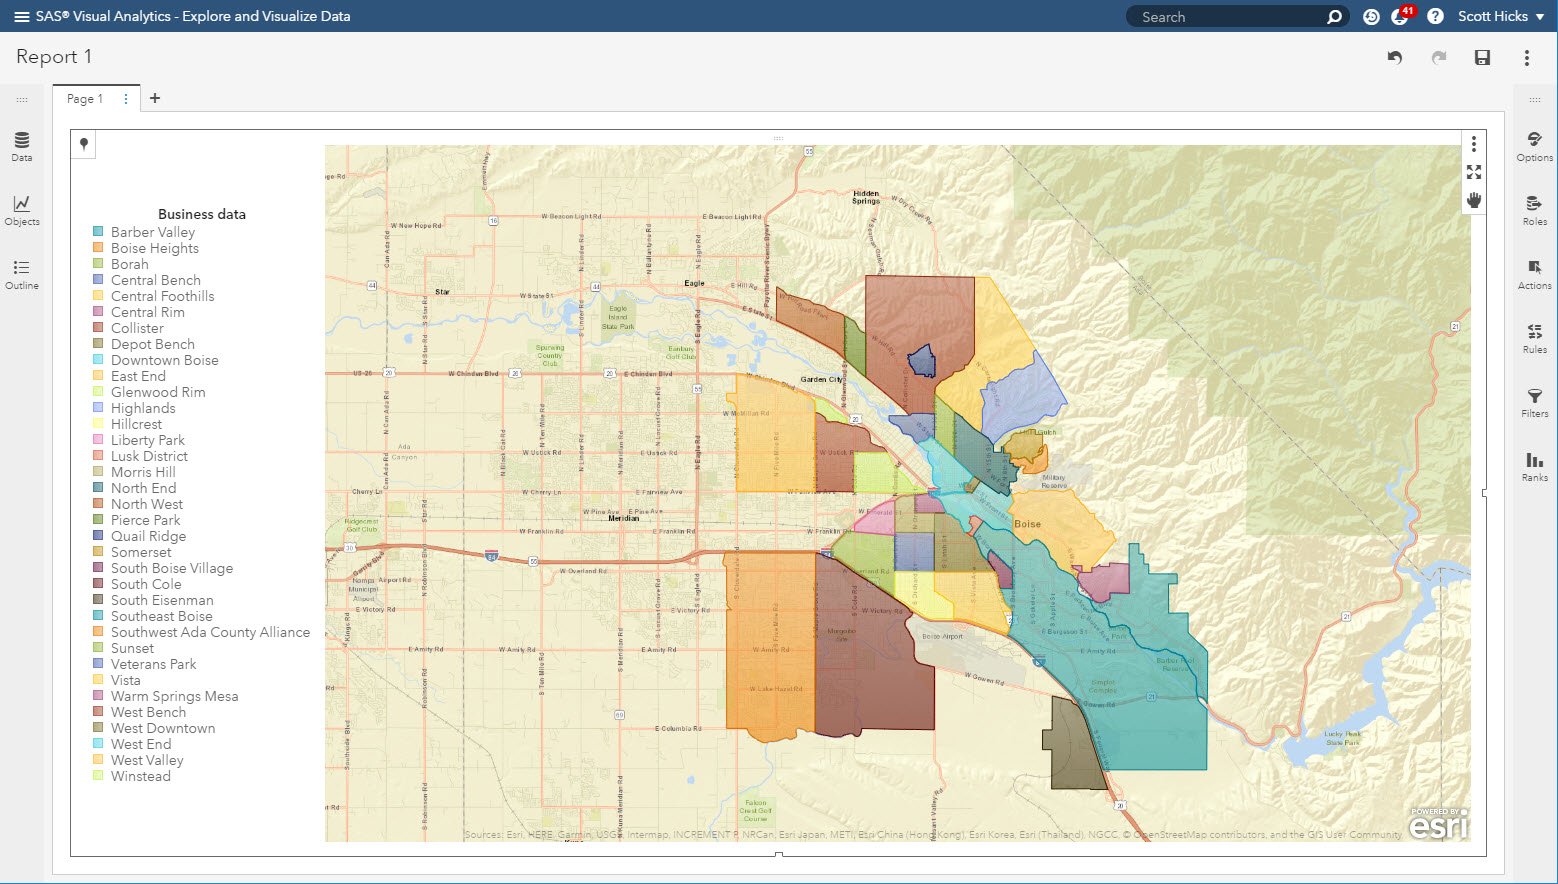
SAS Visual Analytics supports region maps for Country, US states, and provinces out-of-the-box. These work well for small scale maps covering the world, a continent, or a single country. However, other regions are often needed. Beginning in version 8.3, VA supports custom polygons to display regions such as sales territories,
In this post, we continue our discussion of geography variables, the foundation of Visual Analytics Geo maps. This time we will look at Custom Coordinates. As with any statistical graph, understanding your data is key. But when using Custom Coordinates for geographic maps, this understanding becomes even more important. Use
Creating a map with SAS Visual Analytics begins with the geographic variable. This blog post explains the first type of geography variable that VA supports: predefined. Future posts will cover the other two types of geography variables in VA: custom coordinates and custom polygons.
There is certainly no shortage of terrific tips and tricks in various SAS blogs from some of our most distinguished SAS in-house experts. But, there's another group of equally qualified experts who don't often get to share their expertise on this channel: our customers. So, I went on a quest to get