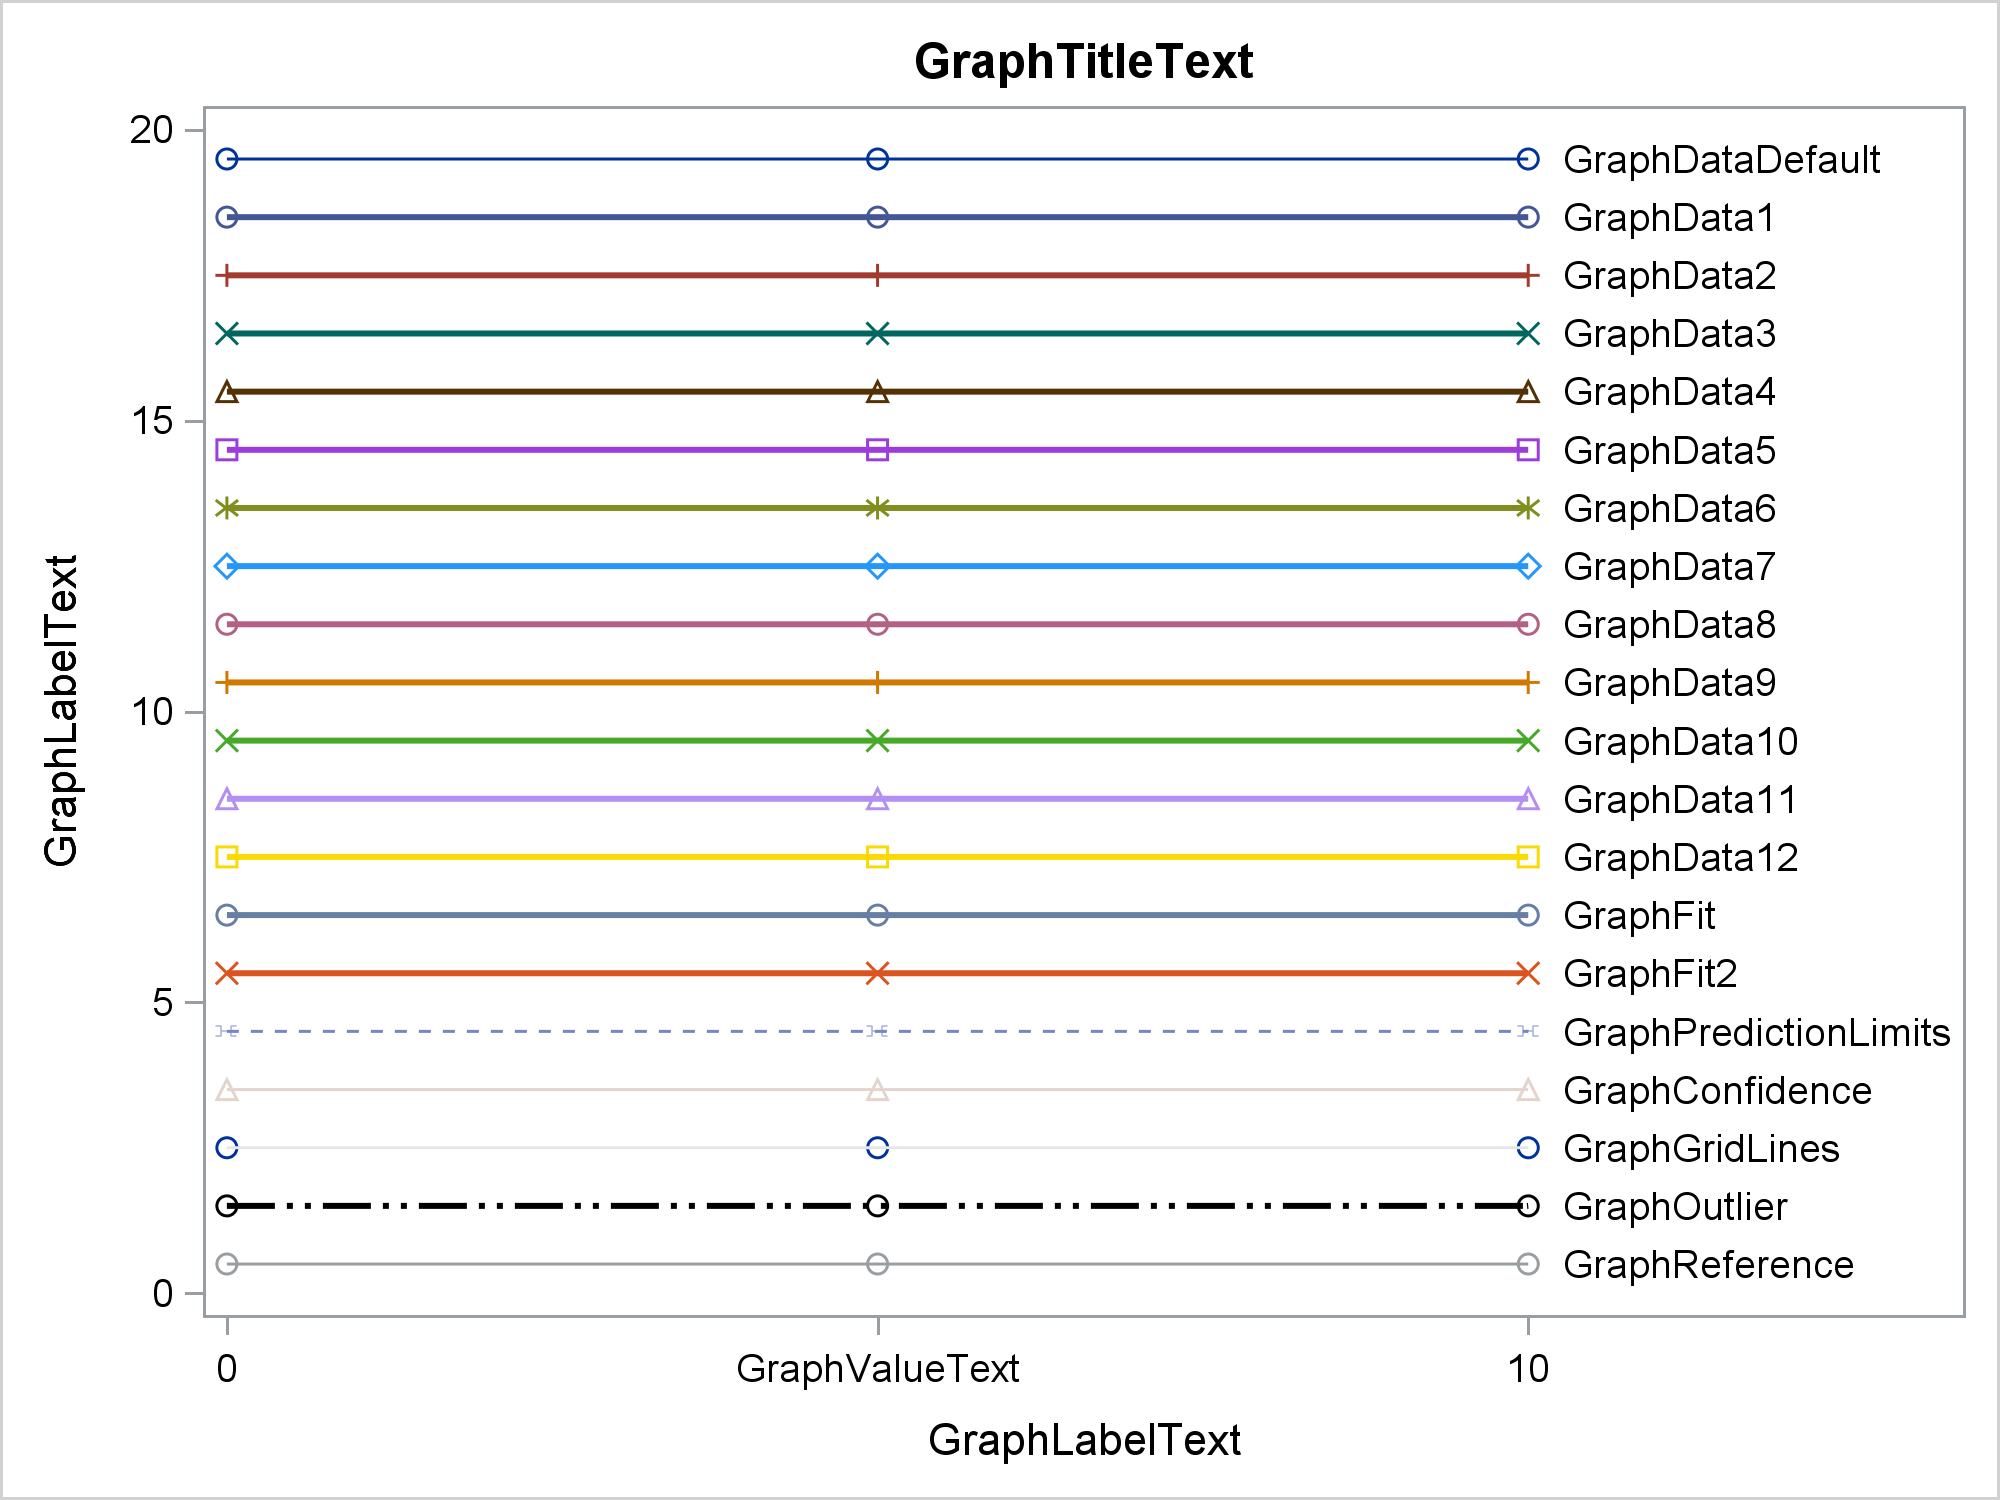
Have you ever wanted to see examples of all of the output styles that SAS provides? You can run a program and look at the resulting file, styles.html. This post explains more about the styles that you will see including a discussion of attribute priority.
Tag: Styles
“The difference between style and fashion is quality.” -Giorgio Armani With an out-of-the-box SAS Enterprise Guide (EG) installation, when you build a report in SAS EG it is displayed in a nice-looking default style. If you like it, you can keep it, and continue reading. If you don’t quite
This post shows a variety of techniques including how to use PROC TEMPLATE and the SOURCE statement, PROC SGPLOT with multiple Y-axis tables, create comparable axes in two side-by-side graphs, create a broken axis, write and use a table template that wraps text, and find and display examples of certain statements in graph templates and fonts in style templates.
ODS Graphics components like GTL and SG procedures are designed to work with Styles to create graphs that are effective in the delivery of information and aesthetically pleasing out of the box. You no longer have to tweak the colors to ensure a nice graph. The graph derives all the