The mystery of the density curve that was too short

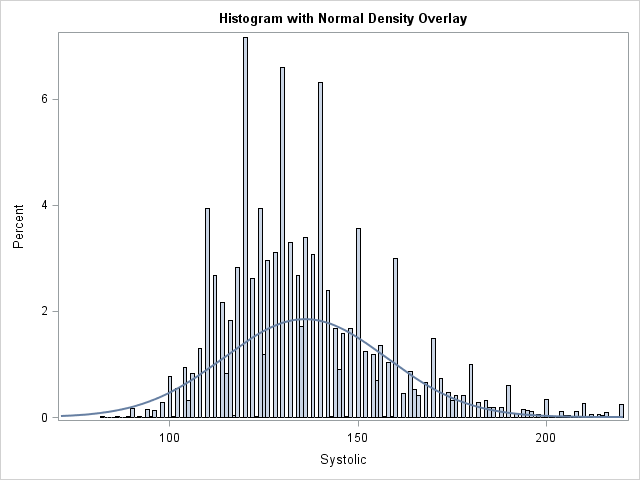
I was reading a statistics book when I encountered a histogram that caught my eye. The histogram looked similar to the one at the left. It contained a normal density estimate overlaid on a histogram, but the height of the density curve seemed too short when compared to the heights