Blog spam: ain't nobody got time for that

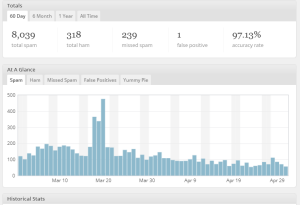
Here at SAS, we've come a long way with how we deal with blog spam on blogs.sas.com. Last year at this time, I was sifting through dozens of spam messages per day in order to salvage the one or two genuine comments that originate from real readers. I was just
