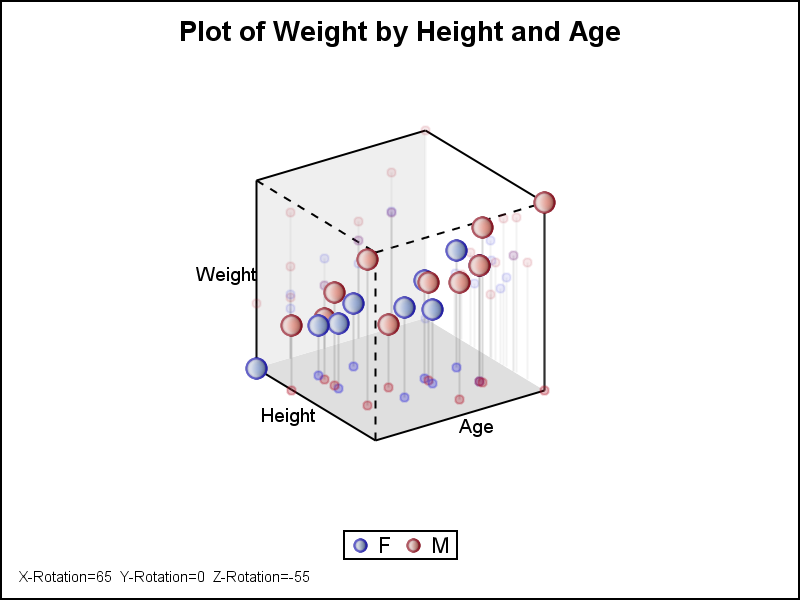
A 3D Scatter Plot Macro

The SG Procedures do not support creating a 3D scatter plot. GTL has some support for 3D graphs, including a 3D Bi-variate Histogram and a 3D Surface, but still no 3D point cloud. The lack of such a feature is not due to any difficulty in doing this as