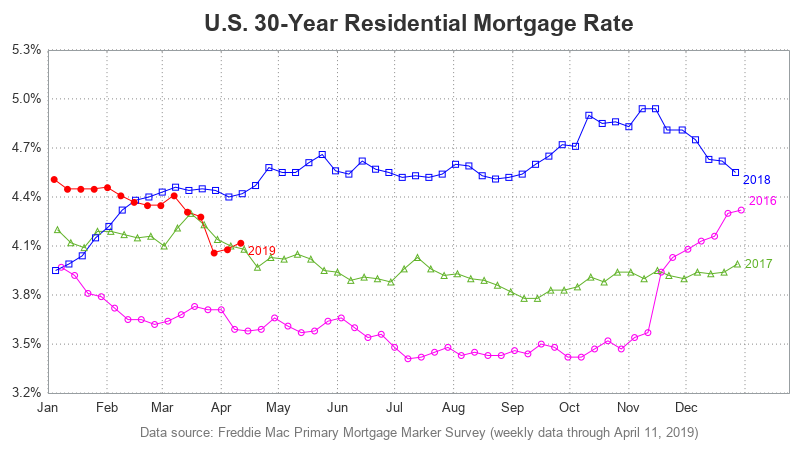
Mortgage rates - overlaying multiple years in the same graph

While we're on the topic of mortgage rates, let's explore another technique for plotting and comparing the rate data over several years. Last time, we plotted each year's data in a separate graph, and paneled them across the page. This time, let's overlay multiple years together in the same graph.