This is another in my series of blog posts where I take a deep dive into converting R graphs into SAS graphs. Today we'll be working on pie charts. I know, I know ... you visualization 'purists' might be wagging your finger at me, and saying "pie charts are no good."
Tag: SGPIE
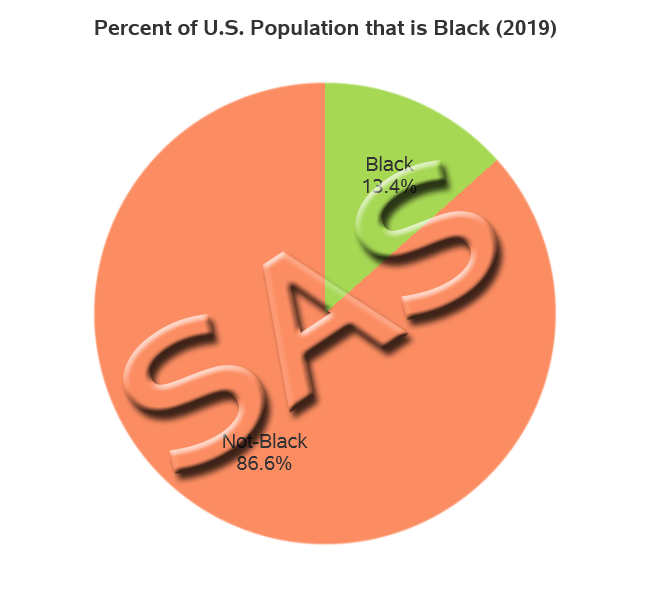
For my third 'Rosetta Graph' example, I will focus on a simple pie chart. Hopefully this example will show you how to convert your SAS/Graph Proc Gchart pies into almost-identical Proc SGpie pies. And speaking of almost-identical pies, here are two beautiful pies my friend Beth made - which one
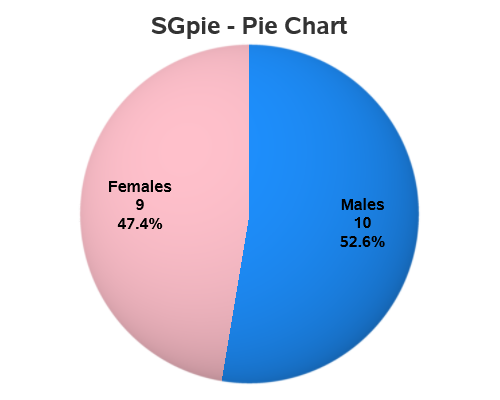
The SAS 9.4M6 software includes a new SGPIE procedure (preproduction) as introduced in the recent article - The SGPIE Procedure. In that article, I described the basic features of the two statements supported in the procedure, the PIE and the DONUT, with some examples. It is my humble opinion that
The 6th maintenance release of SAS 9.4 is now available for users. Along with it comes a new SG procedure - the SGPIE procedure (pre-production). The primary audience for the SG procedures has been the analytical user, for creating effective displays of analytical data. However, the rich feature set of these