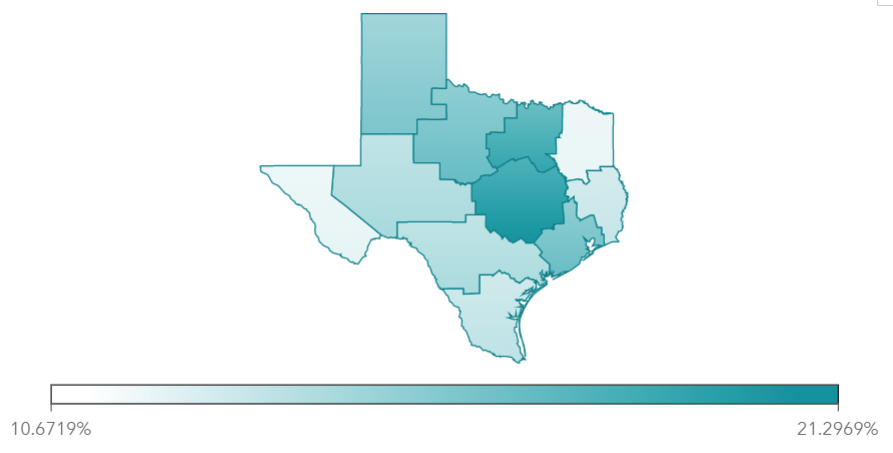
2017年12月にSAS Viyaの最新版3.3がリリースされました。 これに伴い、皆様には、大幅に拡張されたSAS Viyaの機能を存分に体感いただくために今版から、皆様がお持ちの「実データ」でSAS Viyaベースのすべての製品を自由に触っていただけるようになりました。 ぜひ、ご利用ください! 利用手順に関しては、以下のブログをご覧ください。 SAS Viyaを体感してみよう! ~SAS Viya無償試用版利用ガイド~
Another report requirement came my way and I wanted to share how to use our Visual Analytics’ out-of-the-box relative period calculations to solve it. Essentially, we had a customer who wanted to see a metric for every month, the previous month’s value next to it, and lastly the difference between
In my last article, Managing SAS Configuration Directory Security, we stepped through the process for granting specific users more access without opening up access to everyone. One example addressed how to modify security for autoload. There are several other aspects of SAS Visual Analytics that can benefit from a similar