Are you interested in using SAS Visual Analytics 8.2 to visualize a state by regions, but all you have is a county shapefile? As long as you can cross-walk counties to regions, this is easier to do than you might think.
Here are the steps involved:
Step 1
Obtain a county shapefile and extract all components to a folder. For example, I used the US Counties shapefile found in this SAS Visual Analytics community post.
Note: Shapefile is a geospatial data format developed by ESRI. Shapefiles are comprised of multiple files. When you unzip the shapefile found on the community site, make sure to extract all of its components and not just the .shp. You can get more information about shapefiles from this Wikipedia article: https://en.wikipedia.org/wiki/Shapefile.
Step 2
Run PROC MAPIMPORT to convert the shapefile into a SAS map dataset.
libname geo 'C:\Geography'; /*location of the extracted shapefile*/ proc mapimport datafile="C:\Geography\UScounties.shp" out=geo.shapefile_counties; run; |
Step 3
Add a Region variable to your SAS map dataset. If all you need is one state, you can subset the map dataset to keep just the state you need. For example, I only needed Texas, so I used the State_FIPS variable to subset the map dataset:
proc sql; create table temp as select *, /*cross-walk counties to regions*/ case when name='Anderson' then '4' when name='Andrews' then '9' when name='Angelina' then '5' when name='Aransas' then '11', /*more mappings...*/ when name='Zapata' then '11' when name='Zavala' then '8' end as region from geo.shapefile_counties /*subset to Texas*/ where state_fips='48'; quit; |
Step 4
Use PROC GREMOVE to dissolve the boundaries between counties that belong to the same region. It is important to sort the county dataset by region before you run PROC GREMOVE.
proc sort data=temp; by region; run; proc gremove data=temp out=geo.regions_shapefile nodecycle; by region; id name; /*name is county name*/ run; |
Step 5
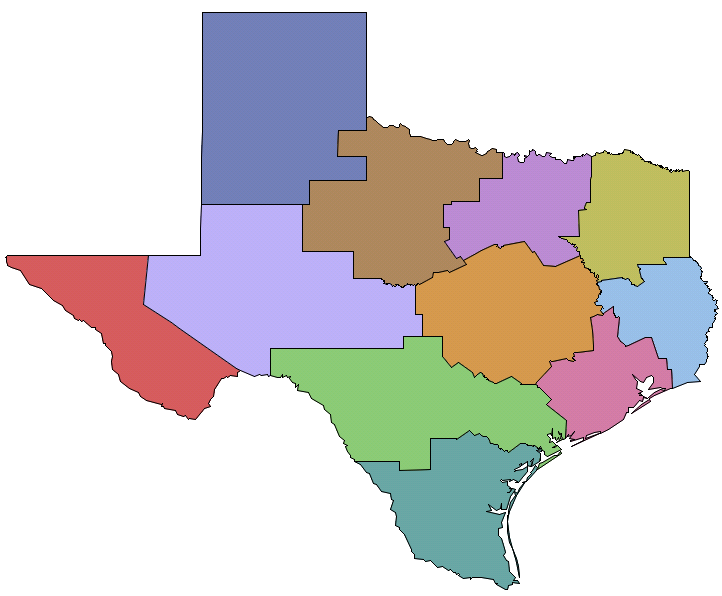
To validate that your boundaries resolved correctly, run PROC GMAP to view the regions. If the regions do not look right when you run this step, it may signal an issue with the underlying data. For example, when I ran this with a county shapefile obtained from Census, I found that some of the counties were mislabeled, which of course, caused the regions to not dissolve correctly.
proc gmap map=geo.regions_shapefile data=geo.regions_shapefile all; id region; choro region / nolegend levels=1; run; |
Here’s the result I got, which is exactly what I expected:
Step 6
Add a sequence number variable to the regions dataset. SAS Visual Analytics 8.2 needs it to properly define a custom polygon inside a report:
data geo.regions_shapefile; set geo.regions_shapefile; seqno=_n_; run; |
Step 7
Load the new region shapefile in SAS Visual Analytics.
Step 8
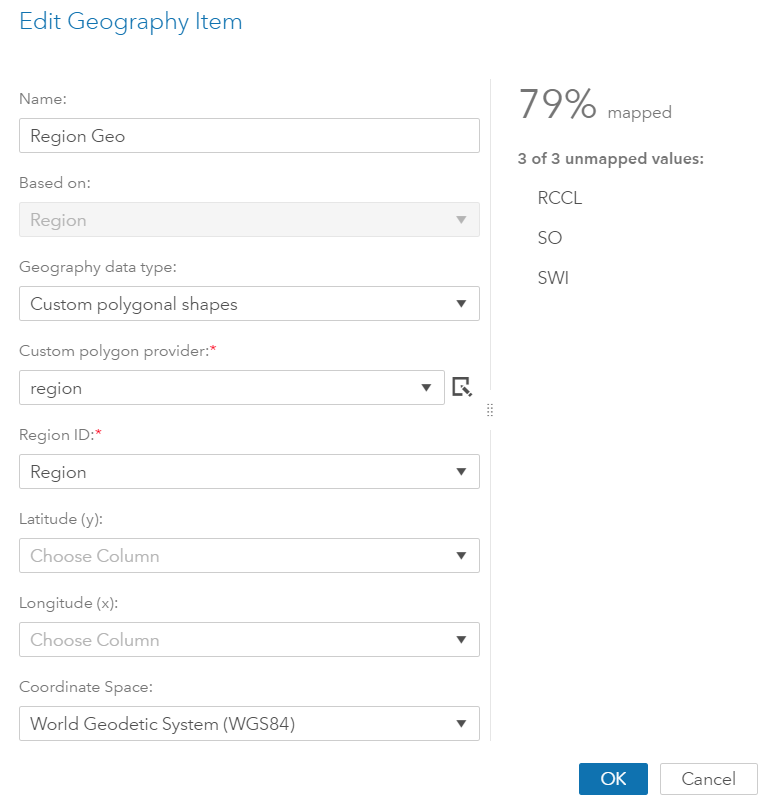
In the dataset with the region variable that you want to visualize, create a new geography variable and define a new custom polygon provider. Note: by default, the ability to add and manage custom map providers is granted to administrators, but can be extended to additional users.
Geography Variable:
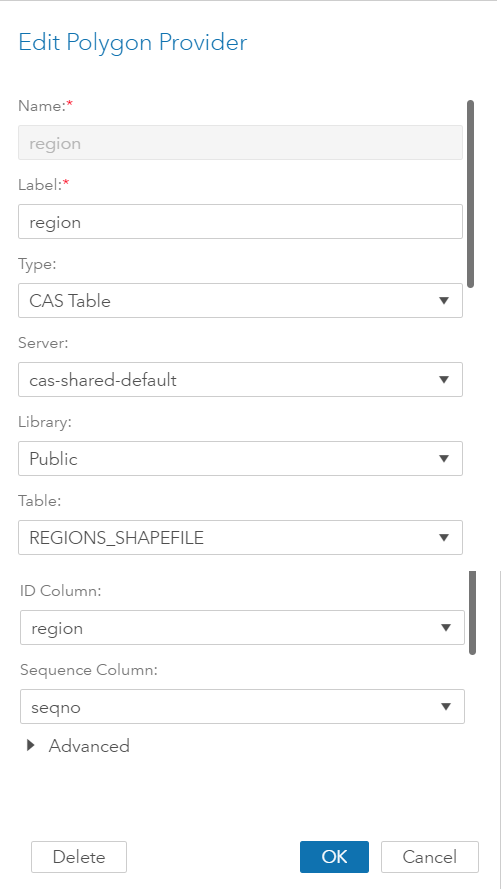
Polygon Provider:
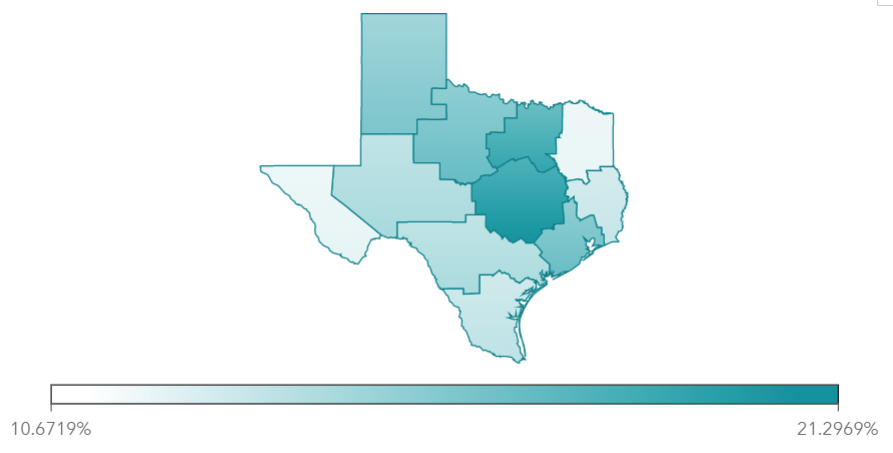
Step 9
Now, you can create a map of your custom regions:

6 Comments
Thanks for this great piece Daria! Really found this so helpful.
Thanks Tazz! You may also find helpful this follow-up blog post, which discusses common issues with custom maps and how to troubleshoot them: https://blogs.sas.com/content/sgf/2018/10/04/troubleshooting-custom-polygon-maps-in-sas-visual-analytics-8-3/
Hi Daria,
Just a small remark for Step 8... (c/p from SAS documentation): "Note: Special user permissions are required to define and edit polygon providers. Create, Delete, and Update permissions must be granted on the /maps/providers URI. For more information, see Access to Functionality in SAS Viya Administration: Identity Management."
Nonetheless, great article!
Jasper
Thanks for your feedback and that's a great point, Jasper! I updated the post.
Daria
Is there a way to add an underlay of either OpenSteetmap or ESRI maps?
Hi Reeza, absolutely. By default, the map will use OpenStreetMap underneath, but you can change it to one of ESRI's base maps. I unchecked the map background for my report in this blog because it made more sense for what I was trying to do.