
3 SAS Viya Workbench use cases for SAS Users

Review these three cool use cases for SAS users, built using SAS Viya Workbench. SAS and Python for better working together!
Review these three cool use cases for SAS users, built using SAS Viya Workbench. SAS and Python for better working together!
In a correlation analysis, it is common to consider the correlations between all pairs of numerical variables. That is, if there are k numerical variables, most people examine the complete k x k matrix of correlations. This matrix is symmetric and has 1s on the diagonal, so more than half of the
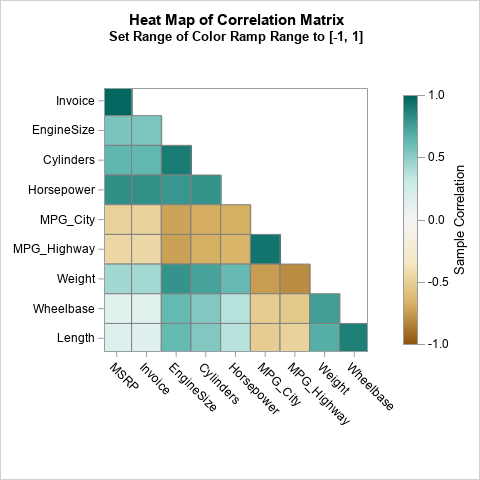
In SAS, range attribute maps enable you to specify the range of values that determine the colors used for graphical elements. There are various examples that use the GTL to define a range attribute map, but fewer examples that show how to use a range attribute map with PROC SGPLOT.
