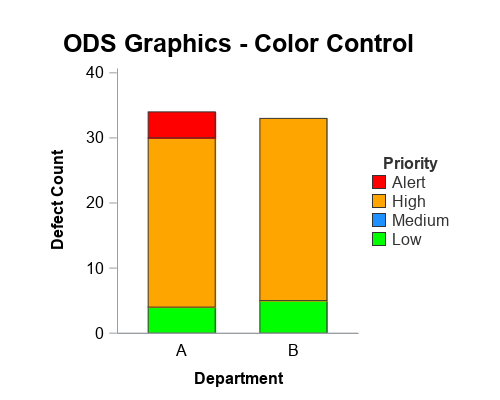
Converting from SAS/Graph to ODS Graphics - color control

In this 'Rosetta Graph' example, I demonstrate how to control bar chart colors in Gchart and SGplot. But first, here's a little diversion... some artwork in my office here at SAS. There's a *lot* of artwork hanging around at SAS, but this particular painting wasn't created by the SAS artists