How to filter variables by percentage of missing values or duplicate values in SAS

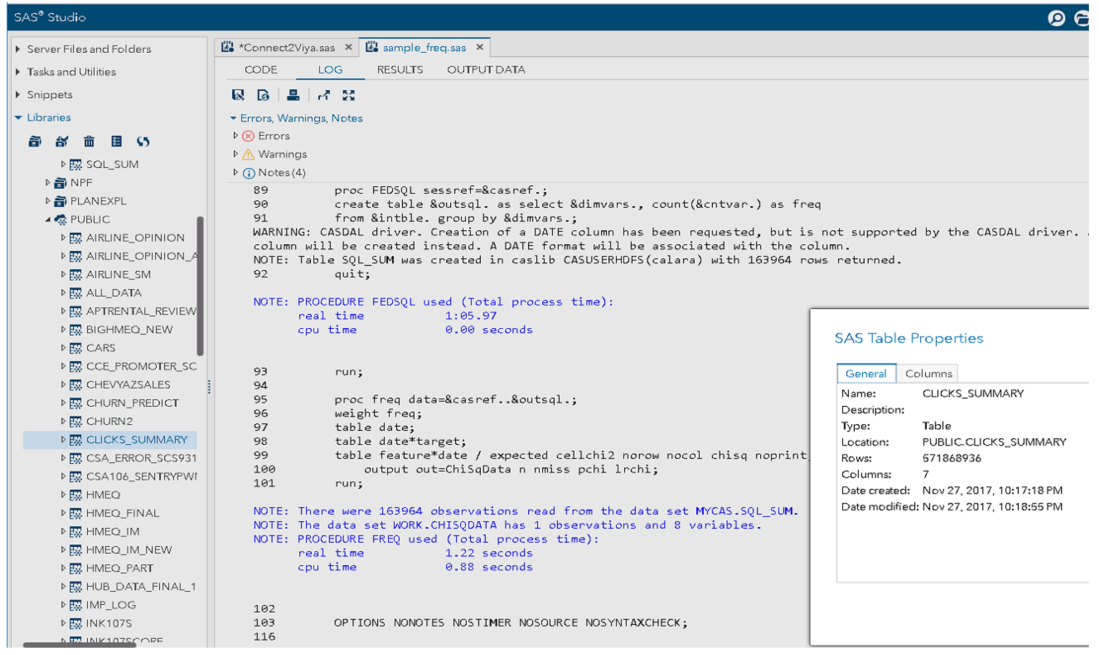
This article discusses how to use SAS to filter variables in a dataset based on the percentage of missing values or duplicate values. The missing value statistics can be implemented by either DATA step programming on your own or reusing the existing powerful PROC FREQ.