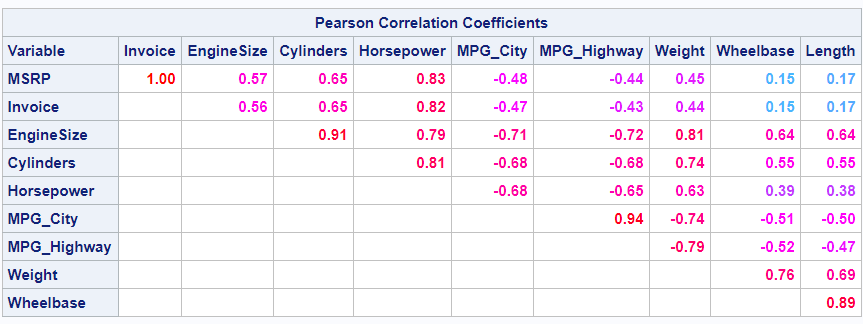
This post shows ways to display the upper or lower triangle of a correlation matrix. You can also use colors to show the magnitude of the correlations.
PROC SGPLOT displays titles inside the graph. If you want to display a title inside the graph and a different title outside the graph, you can use the ODS LAYOUT or the GTL. The ODS LAYOUT gives you precise control over your output and enables you to display multiple graphs and tables in each page.
I was building a nice little PDF report the other day. I love the way ODS PDF replicates the SAS Results window navigation structure as PDF bookmarks, but... I'd much rather write the text for the bookmarks myself. So, I decided to "use the SAS" and make ODS do my