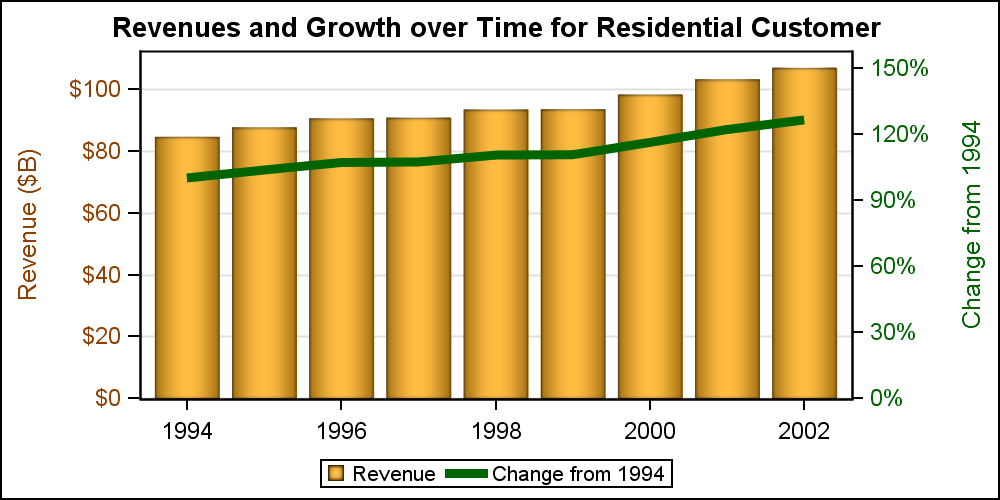
Dual Response Axis Graphs
Often we need graphs that display two or more responses by the same category values. In many cases it is useful to plot both responses on the same response (Y) axis. This can be helpful to understand the data and compare the magnitudes side by side. This works when the scales
