As you've probably guessed, I'm a "visual" person - I like to see things (in a chart/graph/map) rather than just reading about them (in a data table and summary statistic). Don't get me wrong - I'm a big fan of statistics and analytics -- but I'm an even bigger fan of
Tag: international year of statistics
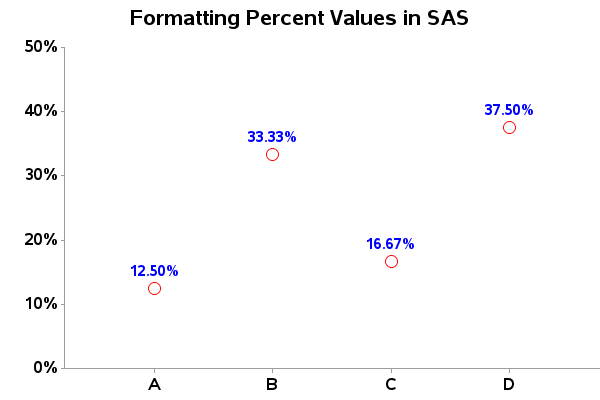
Being that 2013 is the International Year of Statistics, I wanted to make sure everyone knows how to handle my favorite statistic - percent (%) - in SAS! I often see data in spreadsheets/csv/etc that purport to represent "percents"... but you have to be a bit careful when working with
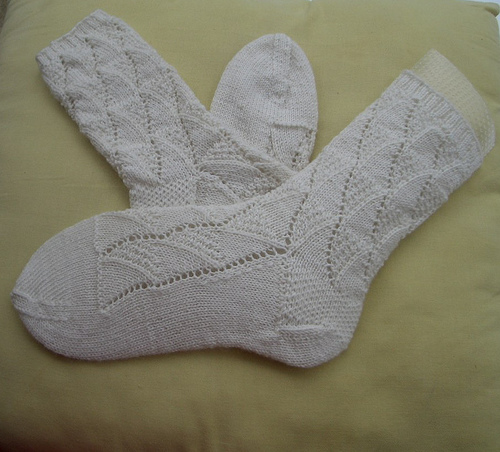
In the spirit of the new year – the International Year of Statistics – I thought I’d share some different ways to use statistics. Can statistics help you in your everyday life? Certainly! And here's an example to prove it... Let's say you have a dresser drawer full of white socks.
Are you ready for the upcoming International Year of Statistics? I have prepared myself by doing a correspondence analysis. Excusez-moi? Correspondence analysis is a technique that has been very popular in France and is therefore sometimes referred to as French Statistics. Correspondence analysis is a technique for categorical data analysis.