If you're into data visualization, here's something that might interest you - a free eBook showing several ways to use SAS to visually analyze your data. (Did I mention it's FREE?!?!) We've picked juicy chapters from several books and upcoming books (and a few other sources), to show you what
Tag: how to learn sas
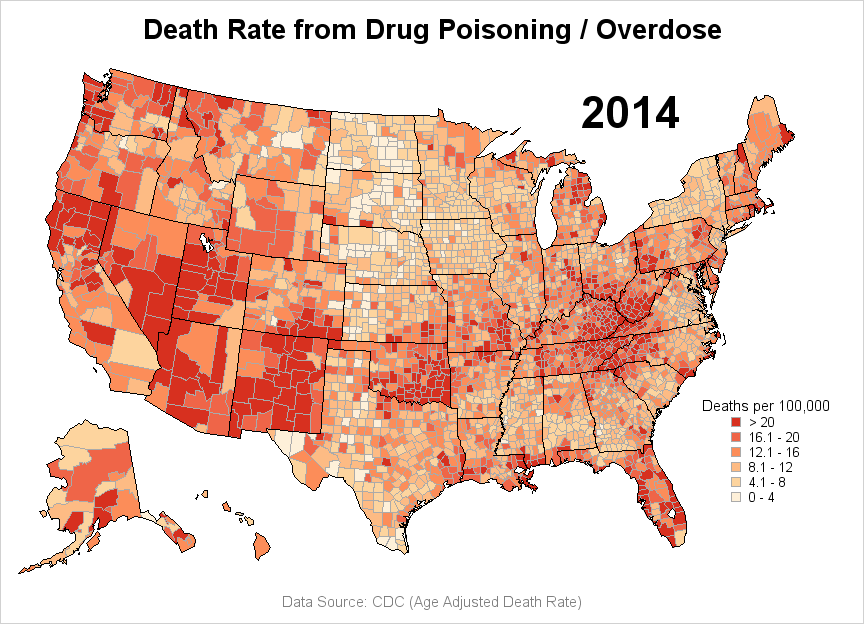
If you're a fan of SAS' ODS Graphics, you probably know that it does pretty much everything except geographical maps. But it's flexible enough that you can "fake it 'till you make it"! This example describes how to fake a geographical (choropleth) heat map using Proc SGplot polygons. In my
If you give an artist some tools, they can create a pretty picture. Sure, they might have a preferred tool - but they can probably do a pretty decent job no matter what you give them (paint, colored pencils, watercolor, charcoal, etc). And creating pretty graphs in SAS is no
The NC Scholastic Chess Championship is coming up this weekend, and my buddy Michael Thomas asked if I might could create a few graphs to help analyze the event data. How could I pass up an opportunity like that?!?! Read along, and find out what graphs I created, and the
Have you been using the SAS/Graph Gmap procedure to plot your data on maps for years, but never knew you could add roads to your maps?!? Follow along in this blog post, and I'll teach you how... But before we get started, here's a picture of a nice aerial view
I've created several hundred SAS graphs over the years. I was just musing to myself this morning how nicely Google lets me peruse through images of my graphs. And I thought some of you might also like to know how to do that... Most of you know how to search for keywords
Anybody can come up with a list of simple colors, such as red, green, and blue. If you're a bit more color savvy, you might even throw in indigo, magenta, and fuchsia. But what about more obscure names such as cornsilk, mistyrose, and midnightblue? This blog post will help you
Did you ever wish you could master SAS/GRAPH, and create graphs and maps that were customized exactly like you wanted them? Then this free eBook is for you! Probably the most memorable book for me was the Necronomicon in the Army of Darkness movie. How many of you liked that
This graph certainly makes it clear! I can see right through your lies! Clearly, you know what you're talking about! We need more transparency in our organization! What was that all about, you might ask?!? ... I was just getting all the obvious puns out of the way, so I
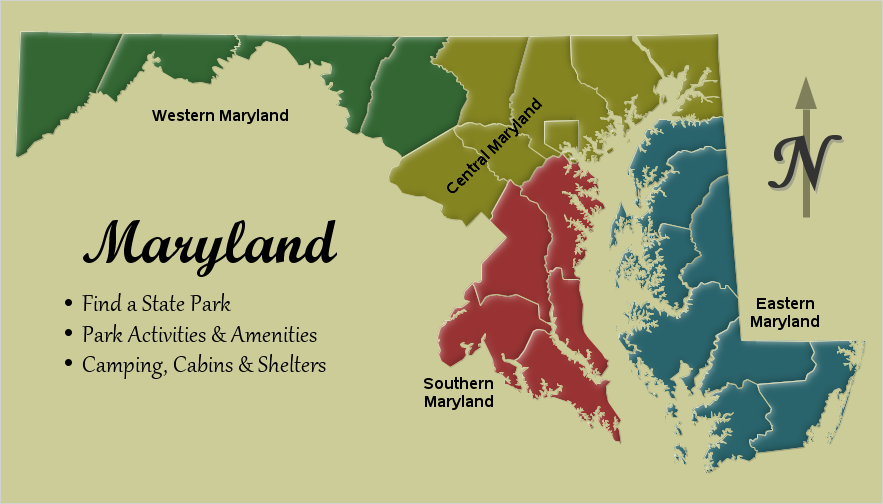
Your biggest problem with maps used to be learning how to fold a paper road map. Today, with the advent of GPS, Google Maps, and location-specific data, the bar has been raised! ... you now need to know how to plot your data on a map! Below are several examples of different kinds
There's an old expression "easy as pie." Have you ever tried to bake a pie??? ... It's not so easy, LOL! And neither is using pie charts correctly! :) Below are several examples of different kinds of pie charts you can create with SAS/GRAPH. And at the bottom of this
Do you know how to create a bar chart using SAS, and when to use what kind of bar chart?!? If the answer doesn't come to you "easy as pie" then this blog is for you! Below are several examples of different kinds of bar charts you can create with SAS/GRAPH.
Do you know (right off the top of your head) the simple SAS/GRAPH code you would use to create line graphs? ... If not, then this tutorial is for you! A line plot is basically a scatter plot where the markers are connected. A line plot should only be used
Scatter plots are probably the simplest kind of graph, and provide a great way to visually look for relationships between two variables. But, do you know (right off the top of your head) the simple SAS/GRAPH code you would use to create them? ... This tutorial leads you step-by-step through the
Have you used multivariate procedures in SAS and wanted to save out scores? Some procedures, such as FACTOR, CANDISC, CANCORR, PRINCOMP, and others have an OUT= option to save scores to the input data set. However, to score a new data set, or to perform scoring with multivariate procedures that