Tag: GTL

Rick Wicklin 0
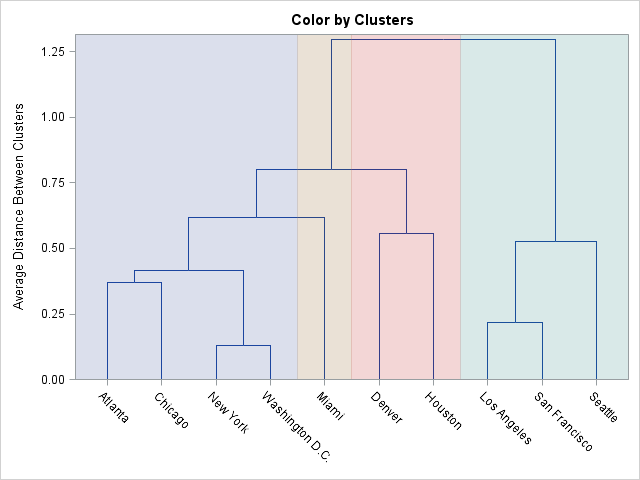
How to color clusters in a dendrogram

The CLUSTER procedure in SAS/STAT software creates a dendrogram automatically. The black-and-white dendrogram is nice, but plain. A SAS customer wanted to know whether it is possible to add color to the dendrogram to emphasize certain clusters. For example, the plot at the left emphasizes a four-cluster scenario for clustering

Data Visualization
Sanjay Matange 0
Schematic Plot

Recently a user chimed in on the SAS Communities page, requesting a way to add some observation level annotation to a box plot.  Wendy was delighted to see a graph created by the UNIVARIATE procedure called "Schematic Plot".  In this graph, the box plot of the analysis variable is shown with

1 20 21 22 23 24 37