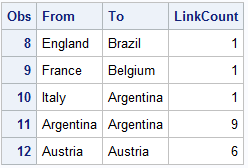
There has been some interest in "Circle Link Graph" diagrams where the nodes are laid out in a circle, with links going from one node in the circle to another. I recall seeing one diagram during the 2014 World Cup Soccer tournament, showing the number of players from one country that
Tag: GroupLC
Outside-the-box: Circle link graph
Clinical Graphs: Spider plot
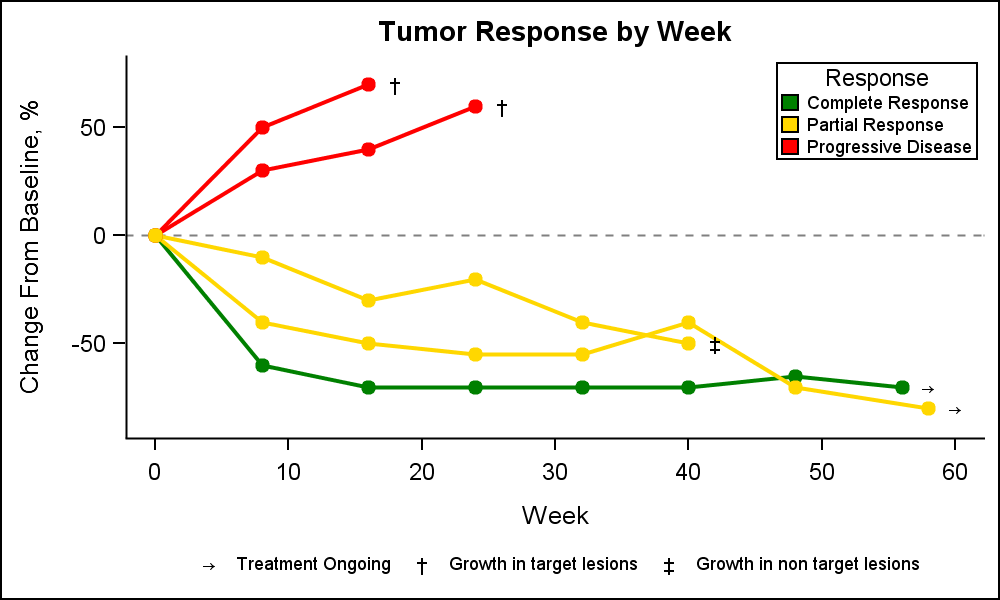
A Spider Plot is another way of presenting the Change from Baseline for tumors for each subject in a study by week. The plot can be classified by response and stage. Another way of displaying Tumor Response data was discussed earlier in the article on Swimmer Plot. This article is prompted
More on Spaghetti Plots
In her article Creating Spaghetti Plots Just got Easy, Lelia McConnell has provided us a glimpse into some new useful features in the SAS 9.4M2 release. The term Spaghetti plots generally refers to cases where time series plots have to be identified by multiple group classifications. The support for the