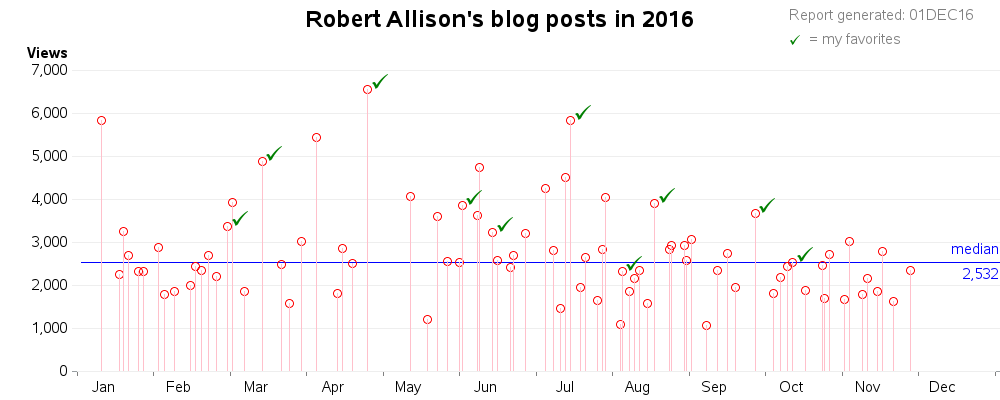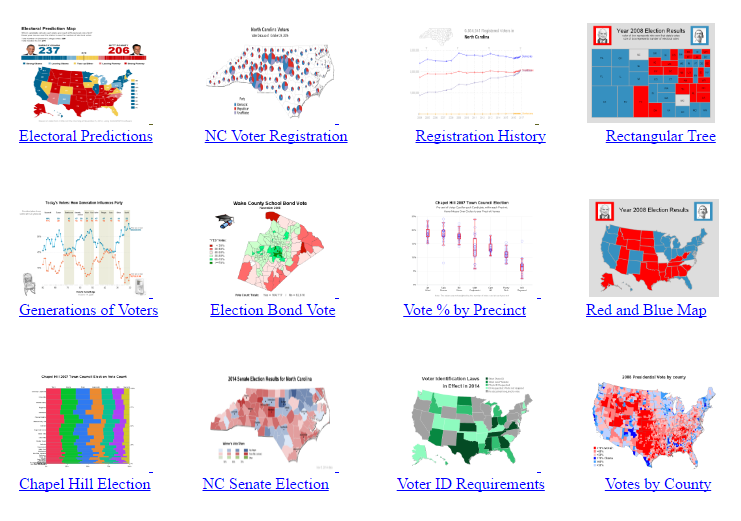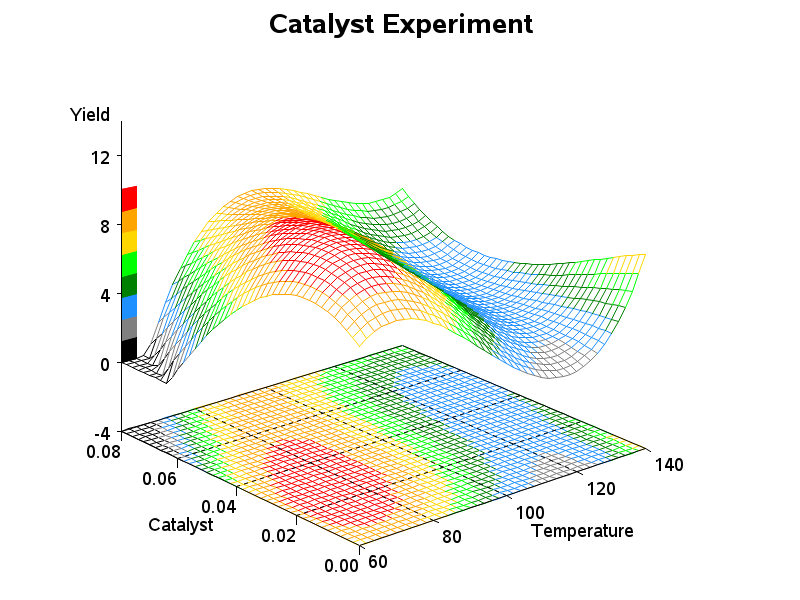
Graphs: Comparing R, Excel, Tableau, SPSS, Matlab, JS, Python, and SAS

Are you a visualization & graphing expert? Can you identify which tool (R, Excel, Tableau, SPSS, Matlab, JS, Python, or SAS) was used to create each of these graphs? No cheating! I recently read Tim Matteson's blog where he presented 18 graphs, and had his readers try to guess which