Graph Table

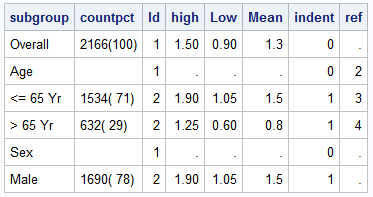
A common scenario is where we have a table of multiple measures over time. Here we have a simple example of Frequency and Response by Day. The Response is a linear function of the Frequency, as shown in the table on the left below. The shape of the data is