How to design a meteorite infographic using NASA data and SAS

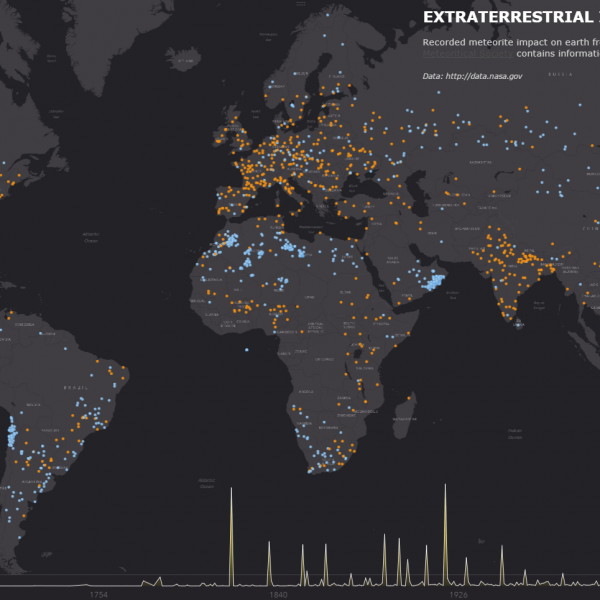
How many meteorites have hit the earth in the last 4,000 years? Where have they landed? And which ones were the biggest? Can we show all of this information - and more in an intuitive data visualization? It turns out NASA provides public data about recorded meteorite impacts on earth all the