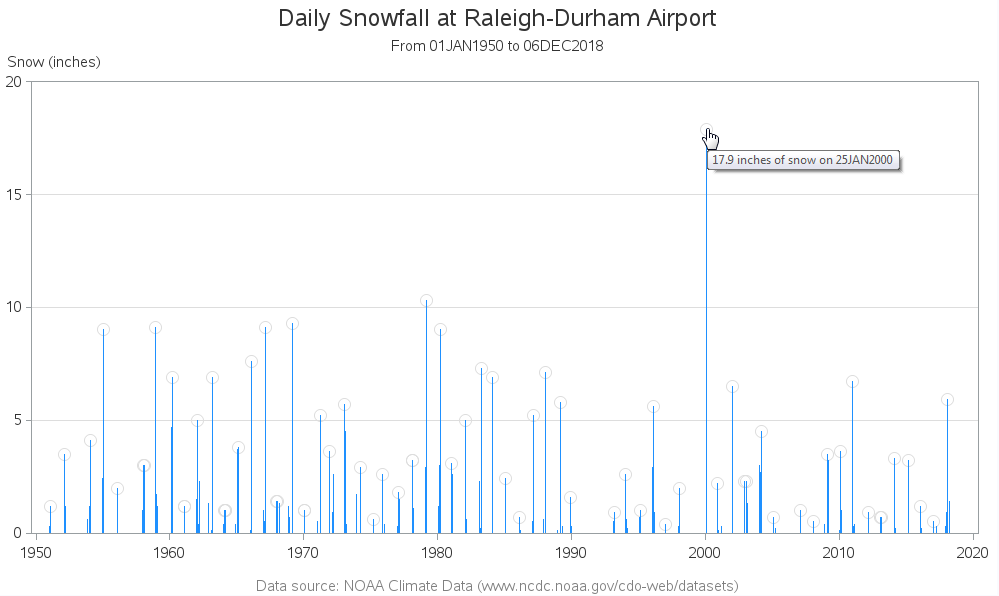
We got our first 'big' snow of the season here at the SAS headquarters in Cary, NC ... therefore I thought this would be a great time to dig into some snow data! Follow along and pick up some tips & tricks as I plot our snow data - and
If you're good at games like Wheel of Fortune, Scrabble, or Words with Friends, you've probably figured out that certain letters appear more often than others. But do you have a cool way to figure out which letters appear most & least frequently? How about using a computer to plot
There were 97 e-posters in The Quad demo room at SAS Global Forum this year. And the one that caught my eye was Ted Conway's "Periodic Table of Introductory SAS ODS Graphics Examples." Here's a picture of Ted fielding some questions from an interested user... He created a nice/fun graphic,