A few weeks back I posted an article on ways to create a WindRose Graph using SGPLOT procedure. The process is relatively simple. Create (R, Theta) data with both numeric axes where the Theta is a value in the data range is 0-360, and R is the corresponding response value. Then
Tag: ColorResponse
Likert Graph Revisited
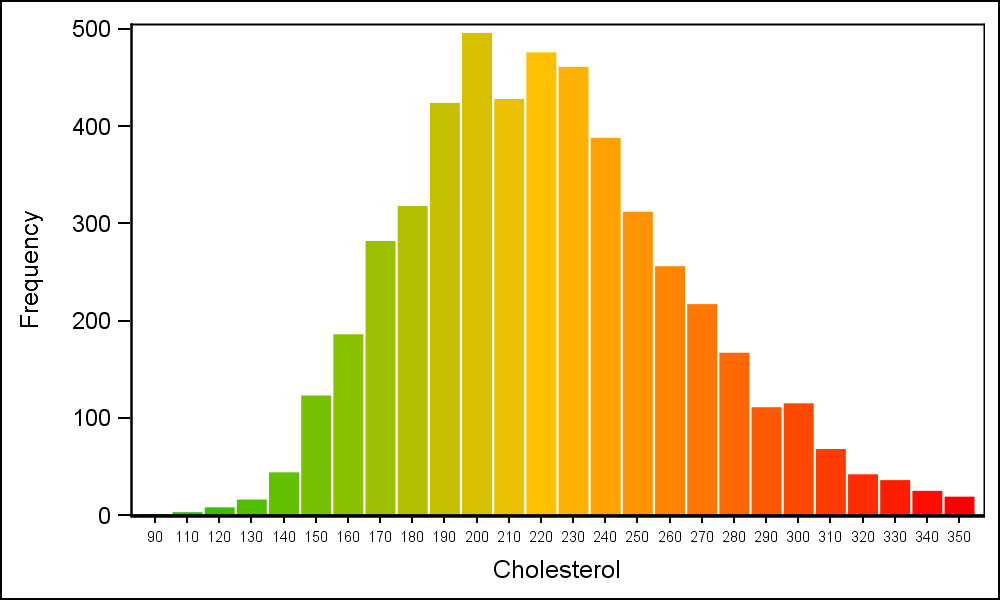
Histogram with Gradient Color
Recently a user posted a query on the SAS Communities page asking on how to create a histogram where the bins of the histogram are colored by the analysis variable using a three color ramp. Essentially, he wanted the bins to be colored from "Low" to "High" along the horizontal
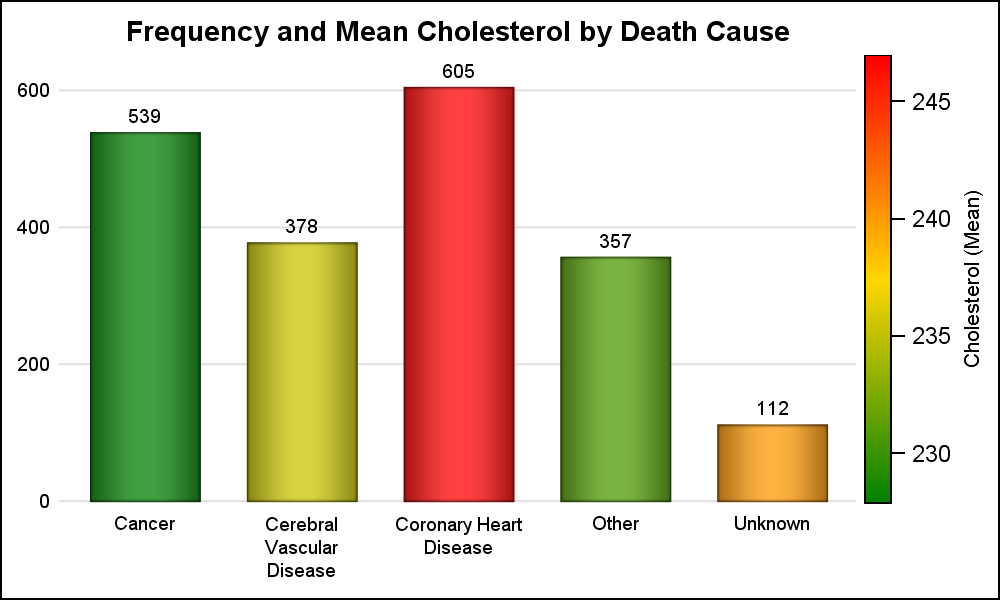
Response Colors and Thickness
Often there is a need to display more than one response simultaneously for a bar chart, series plot or a vector plot. SAS 9.40M3 adds the options you need to get such results using two new options COLORRESPONSE and THICKRESPONSE where applicable. The Bar Chart on the right shows the frequency