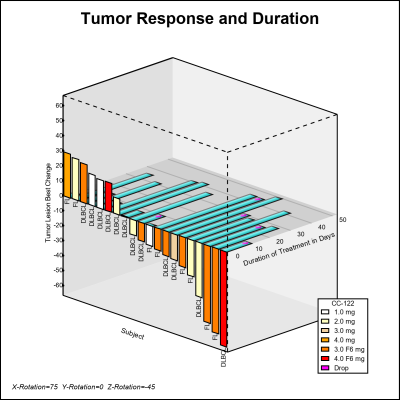
A while back a user requested to create a 3D WaterFall chart as presented by E Castanon Alvarez et. al. in "3D waterfall plots: a better graphical representation of tumor response in oncology" Annals of Oncology, Volume 28, Issue 3, 1 March 2017, Pages 454–456. I posted a blog article titled
Tag: Clinical Graph
3D WaterFall Chart - Redux
Lab Values Panel
It was almost two weeks ago that I got started making a display for lab tests for a subject, based on a graph I saw on the web for an article on this blog. This graph is a part of a larger panel display of the lab values for a
SG Procedures Book Samples: Adverse Event Timeline
Here is the second installment of sample graphs from the SG Procedures book - The Adverse Event Timeline. This is a graph commonly used in patient profiles for clinical trials where we track the progress of a patient through a hospitalization event, tracking the dates and severity of the adverse events. The