“Technology is an industry that eats its young, it is rare to come across providers that have been around for more than a human generation.”
Tony Bear, Big on Data
With more than 40 years in the market, SAS is one of the rare technology providers that has been around for more than a generation. And SAS has always viewed technology advances as evolution, not revolution. Having a long and rich history, we are well-equipped for future challenges. Today it is my great pleasure to talk to Randy Tobias, Statistical Development Lead from our Scientific Computing team, and learn from his experience as a statistical programmer, mentor, and leader at SAS.
Meet Randy Tobias
 Udo: What's your history with statistical development at SAS, Randy?
Randy: I was hired in 1986, fresh out of grad school in Mathematical Statistics at the University of North Carolina at Chapel Hill. I had also worked as a programmer in Raleigh's Research Triangle. That kind of background is pretty common among our statistical developers---a solid grounding in some useful area of statistics, plus good programming skills. Nowadays we have to emphasize "low-level programming." But back then, if you were a statistician who could use a computer, you could probably program.
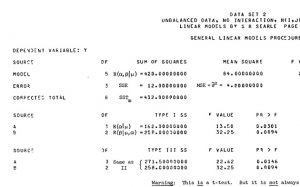
I helped support statistical procedures from the start, converting them from PL1 on mainframes to C on PCs. I also worked on experimental design facilities for SAS/QC. After a few years, I took over support for PROC GLM, Dr Goodnight's seminal procedure for linear modelling. Through that assignment, I made connections to key customers and researchers.
Over the years I have continued to develop SAS facilities for both experimental design and linear models, as a developer, as a manager, and as an author. My books include Optimum Experimental Designs, With SAS and Multiple Comparisons and Multiple Tests Using the SAS System. Teams that I have directly led have also worked on areas as diverse as survey sample design and analysis, generalized linear mixed models, logistic regression, nonparametric modeling and inference, statistical power and sample size determination, and spatial analysis.
Why SAS is the leader in statistics
Udo: Wow, that's a lot of experience! You've been involved with statistical development at SAS for a long time and from many different angles. SAS has towered over other products in this field - especially in terms of its reputation for excellence. What do you think accounts for that?

Randy: There are so many components to it, starting with how we choose what to implement. SAS statistical developers over the years have been strongly motivated not only to meet customers' current needs, but also to anticipate where they're going to be down the road and meet those needs too. From what I've heard, Dr. Goodnight had that very much in mind in developing PROC GLM back in the '70s. He didn't want to program up a bunch of different ways to do inference for unbalanced linear models; he wanted to handle it all in one go.
So, relying on his own statistical expertise and that of academic colleagues (I think of Shayle Searle at Cornell and his Annotated Computer Outputs), he developed methods that could estimate any (linear) parametric function that was estimable. And they gave reasonable inferences whether or not the data was balanced. This was more than everyone knew they wanted at first, but time told that his instincts were right. PROC GLM soon became a standard tool for much statistical analysis in research and industry and government. And it still is.
Time and again over the years, I've seen statistical development at SAS stay true to the ethic of developing statistical tools for power and extensibility while meeting as well as anticipating future customers' needs. Like Dr. Goodnight with GLM, we haven’t relied solely on our own judgment for this. We have a strong tradition of professional engagement in the American Statistical Association (ASA) and other professional organizations. We have had fellows and section chairs and Founder's awardees and even an ASA president among our ranks. This has connected us to experts and allies whose perspective and experience are immensely helpful in discerning which methods are ready for prime time.
For myself, I could easily rattle off the names of a couple of dozen eminent researchers who have helped me in this way in just my own development work. Multiply that by all of the developers who work on our statistical tools, present and past, and you've got a small army of expert statisticians contributing their advice. To be clear, we are not just programmers implementing other folks' ideas. Our own experience can make us valuable collaborators for them too. This is especially so when it comes to developing software that is usable and robust and efficient, so that we are usually regarded as joint researchers.
Collaboration with other experts in the field
Udo: Yes, I see that having and maintaining your professional expertise contributes directly to the software. But it also fosters collaboration with other experts who can help guide the work. Can you think of some examples over the years where you've seen this interplay between theory, application, users, and external experts?
Randy: Sure. Take dealing with non-response in surveys. It can be caused by anything from embarrassing health questionnaires to shy voting habits, and obviously it can bias survey results. There are many special methods for dealing with non-response, and big statistical agencies and organizations even have their own SAS code for it. But for something that is robust and efficient for a lot of different situations, we decided to go with a relatively new idea, fractional imputation (FI). We worked with researchers at Iowa State to extend FI to many variables. Currently, ongoing work on survey calibration---adjusting survey data for known population characteristics---is taking a very similar path. Stat Canada, the Canadian government statistical agency, is providing a lot of motivation and we’re getting advice on approaches from associates at the University of Montreal.

As another example, consider PROC BGLIMM, for analyzing generalized linear mixed models (GLMMs) with Bayesian techniques. GLMMs are key tools in modern statistics, extending PROC GLM, PROC GENMOD and PROC MIXED, three key PROCs for our users. A frequentist approach to analyzing them is implemented in PROC GLIMMIX, which Oliver Schabenberger developed over a decade ago.
I have heard expert applied statisticians call PROC GLIMMIX almost the only statistical tool they ever need to use. But users wanted ways to incorporate prior information in their analyses, and that's where PROC BGLIMM comes in. The basic methodology was clear from what we implemented in our general Bayesian procedure, PROC MCMC, but there were special issues for GLMMs, and for resolving those issues our contacts at UNC and NCSU and elsewhere were invaluable.
Breakthroughs in statistics
Udo: Even though it’s such an established field, I know there are still breakthroughs in statistics. Which recent ones are particularly exciting to you?
Randy: Yes, certainly there are breakthroughs. Statistics is a servant science, existing only to make sense of data from other fields. As we all know, data in all areas of human endeavor is changing and growing all the time. So appropriate statistical methods also have to change and grow. Just based on my own experience, I’d draw attention to the following areas:
- Predictive methods that handle massive amounts of data with complex structure. Often this data is so large that it needs to be distributed across a grid. Thus, the methods for handling it also have to be distributed.
- Algorithmic breakthroughs that make infeasible analyses possible – this would include the network algorithm for exact categorical analysis, sparse methods for mixed models, graphical models for Bayesian random effects, and most recently, the fast quantile process regression work of my colleague, Yonggang Yao.
- Causal analysis, for making causal inferences based on observational data – this has been the topic of a couple recent blogs in this series.
- Digital experimentation – familiar statistical design of experiments techniques applied to on-line media. There was a lot of buzz about this at this year’s Joint Statistical Meetings. In particular, I heard that organizations like NetFlix are running on the order of 1,000 simultaneous experiments per day!
Udo: I know that you did a lot of background research recently on the chronology of SAS statistical development over the past 50 years. Do you care to say anything about turning points you see in what you've collected?
Randy: Only with great humility and trepidation, or not at all. I mean, statistical development at SAS is not just one story; it's dozens, for each application field covered. Even considering the aspects of statistics that cut across application fields, there are many stories to tell. For some, the growth of computing power and availability was critical. I'm thinking of the expansion of graphics from a specialized analytic task to something that almost all statistical PROCs do. And of course, there’s the ever-increasing need and capacity for handling lots of data.
But there are also stories that aren't directly affected by computing: stories about evolving modes of inference and increasingly complex methodology for handling correlation. And nothing that we've discussed even touches on the hugely important fields of spatial analysis, handling missing data, latent factor methods, prediction versus inference, survival analysis, quantile regression, and on and on.
Sorry, it's too much for me to even try to summarize! But I'm confident that our modus operandi of expert statistician programmers talking directly to users and to theoreticians, and working with the latter to solve problems for the former, will continue to serve SAS well into the future.
Udo: Randy, many thanks for your time today and for sharing your insights.
Read more from Randy by ordering his book on Multiple Comparisons and Multiple Tests


