We have updated our software for improved interpretability since this post was written. For the latest on this topic, read our new series on model-agnostic interpretability.
Don`t jump into modelling. First, understand and explore your data!
This is common advice for many data scientists. If your data set is messy, building models will not help you to solve your problem. What will happen is “garbage in, garbage out.” In order to build a powerful machine learning system, we need to explore and understand our data set before we define a predictive task and solve it.

Data scientists spend most of their time exploring, cleaning and preparing their data for modelling. This helps them to build accurate models and check assumptions required for fitting models.
What can you do to look at your data?
- If your data consists of millions of observations, you cannot look at all of them. You cannot look at the first 100 observations, and make conclusions based on that. Alternatively, you cannot just look 100 random observations to get an idea of your data set.
- If your data consists of thousands of variables, you cannot plot statistics for all of them.
- If your data consists of heterogeneous variables, you cannot treat all variables in the same way.
What you can do is to use different exploratory data analysis and visualization techniques to have a better understanding of your data set. This can include summarizing the main characteristics of your data set, finding representative or critical points in your data set, and finding the relevant features from your data set. After you have an overall understanding of your data set, you need to think about which observations and features you are going to use in modeling.
Summary statistics with visualization
You can use summary statistics to understand the continuous (interval) and discrete (nominal) variables in your data set. You can analyze them individually or together. They can help you to find several issues such as unexpected values, proportion of missing values compared to the whole data set, skewness, and so on. You can compare the distribution of feature values across different features. You can also compare feature statistics for training and test data sets. This can help you to uncover differences between them.
You need to be careful about summary statistics. Excessive trust on summary statistics can hide problems in your data set. It may be wise to use additional techniques to get a full understanding of your data set.

Example-based explanations
Assume that you received a data set with millions of observations with thousands of variables. It is challenging to understand this data set without using any abstraction. One approach to solve this problem is to use example-based explanations. Those techniques can help you to pick observations and dimensions that are important for understanding your data. They can help you to interpret highly complex big data sets with different distributions.
The techniques available to solve this problem include finding observations and dimensions to characterize, to criticize and to distinguish the groups in your data set.
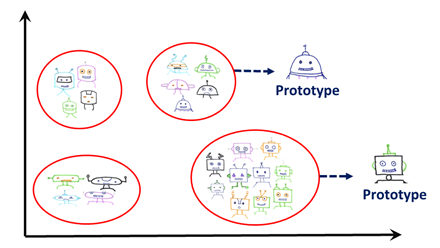
- Characterize: As humans, we usually use representative examples from the data for categorization and decision making. Those representative examples are usually called prototypes. They are the observations that best describe categories in a dataset. They can be used to interpret the categories since it is hard to make interpretations using all the observations in a certain category.

- Criticize: Finding prototypes alone is not sufficient to understand the data since it causes overgeneralization. There may be variations among the shared features in a certain group that cannot be captured by prototypes. Thus we need to show exceptions (criticisms) to the rules. Those observations can be considered as minority observations that are very different from the prototype, but still belong in the same category.
For instance, the robot pictures in each category consist of robots with different head and body shapes. Pictures of robots wearing a costume can also belong to one of those categories although they can be very different from a typical robot picture. Those pictures are important to understand the data, since they are important minorities.
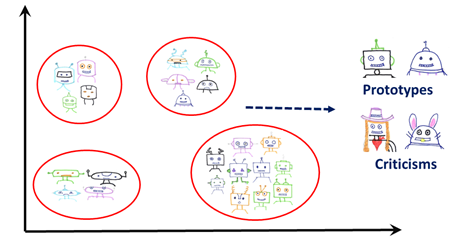
Been Kim`s work in this area focuses on finding those minorities while finding prototypes using an unsupervised technique called maximum mean discrepancy (MMD) critic. Here, MMD selects prototypes to represent the full data set. Then, it selects criticisms from parts of the data set that are not represented by prototypes. While choosing criticism points, MMD critic makes sure that those points are diverse and differ substantially from the prototypes. This method can be applied to unlabeled data to characterize the data set as whole. It can also be applied to labeled data to understand different categories.
- Distinguish: Finding representatives may not always be enough. If the number of features is high, it will still be hard to understand the selected observations. This is because humans cannot comprehend long and complicated explanations. The explanations need to be simple.
In this case, you need to look at the most important features for those selected observations. Subspace representation is a solution to that problem. Using the prototype and subspace representation helps in interpretability. One method that can be used to achieve this is Bayesian Case Model (BCM). This method is an unsupervised learning method, in which the underlying data is modelled using a mixture model and a set of features that are important for each cluster.
In addition to understanding the important features, it is also important to understand the differences between clusters for many applications such as differential diagnosis. For that, you need to find distinguishing dimensions in your data. A mind the gap model (MGM) [Ref] combines extractive and selective approaches to achieve that. It reports a global set of distinguishable dimensions to assist with further data exploration.
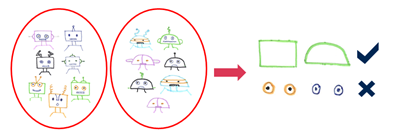
In the above example, by looking at the features extracted from different robot pictures we can say that shape of the head is a distinguishing dimension. However, we cannot say that for eyes since they look very similar.
Embedding techniques
An embedding is a mapping from discrete values (e.g. words, observations) to vectors. You can use different embedding techniques to visualize the lower-dimensional representation of your data set. Embeddings can be in hundreds of dimensions. The common way to understand them is to project them into two or three dimensions. They are useful for many things:
- You can use them to explore the local neighborhoods. You may want to explore the closest points to a given point to make sure that those points are related to each other. You can select those points and do further analysis on them. You can use them to understand the behavior of your model.
- You can use them to analyze the global structure. You may want to find groups of points. This can help you to find clusters and outliers in your data set.
There are many methods for obtaining embedding:
- Principal component analysis: This is an effective algorithm to reduce the dimensionality of your data, especially when there are strong linear relationships among variables. It a linear deterministic algorithm to capture the data variation in as few dimensions as possible.
It can be used to highlight the variations and eliminate dimensions. You can retain the first few principal components that consider a significant amount of variation if you want to interpret the data. The remaining principal components account for trivial amounts of variance. Thus, they should not be retained for interpretability and analysis purposes.
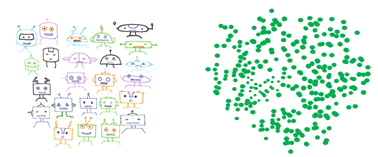
- T-distributed stochastic neighbor embedding (t-SNE): T-SNE is a dimension reduction algorithm that tries to preserve local neighborhoods in the data. It is nonlinear and nondetermistic. You can choose to compute 2 or 3D projections. T-SNE can find structures that other methods may miss.
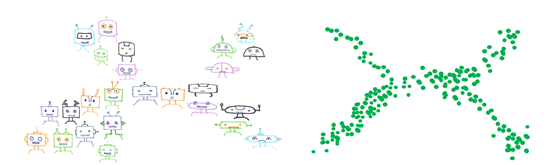
It is very useful to visualize and interpret the datasets if you know how to use them. But there are many things that you need to be careful about. While preserving the local structure, it may distort the global structure. If you want more information about what you need to avoid about t-sne, there is a great article at distill.pub titled, How to Use t-SNE Effectively. You should definitely check it:
Using t-SNE embeddings can help you to reduce the dimension of the data and find structures. However, if you have very large data set, understanding the projections can still be hard. You may want to check the geometry of the data to get a better understanding of the data set.
Topological data analysis (TDA)
Topology is the field that studies the geometric features that are preserved when we deform the object without tearing it. Topological data analysis provides tools to study the geometric features of data using topology. This includes detecting and visualizing the features, and the statistical measures related with those. Here geometric features can be distinct clusters, loops and tendrils in the data. If you have a loop in this network, you can conclude that there is a pattern that occurs periodically in this data set.
Mapper algorithms in TDA are very useful for data visualization and clustering. You can create topological networks of your data set in which nodes are the group of similar observations and the edges connect the nodes if they have an observation in common.
Conclusion
Understanding and interpreting data is a very crucial step for machine learning. In this blog post, we tried to provide an overview of techniques that can help you to better know your data.
Depending on the size, dimension and type of your data, you can choose the algorithm. For instance, when you have big raw data, you can use representative examples instead of random samples. If you have a wide data set, you can also find the important dimensions to understand the representative samples.
Different techniques can give you different insights about your data. It is your job to use the tools to solve the mystery like a detective.
This is the second post in our interpretability series. In future posts we’ll cover interpretability techniques for understanding black box models, and we’ll look at recent advances in interpretability.
You can also watch the webinar: Implementing AI Systems with Interpretability, Transparency and Trust


1 Comment
Thanks for sharing examples to show steps for better understanding data science.