This article is part two of the Empower your insights with SAS for Microsoft 365 blog series.
In this blog series' first article about Excel, you met Franco, who works with data in his role at the fictional retail company eCalico.
Now, meet Sydney! Inspired by the character Sydney from FX’s the Bear, the Sydney you’ll learn about today spends her time making data-driven decisions as a business leader rather than perfecting the omelette as a professional chef. However, both Sydneys have one very important trait in common – they’re leaders who thrive working creatively and collaboratively.
Sydney works at eCalico as a department head. In her job, Sydney needs to make quick decisions that help eCalico grow, but doesn’t have the time to dig into data. She relies on data analysts, data scientists and business analysts to work with data hands-on and deliver business insights that she can quickly act on.
Sydney can also share insights with fellow decision-makers and access them in the place that she works most – email! Using SAS for Microsoft 365, Sydney can view the information she needs right from her email.
By simply logging into SAS Viya from her Outlook application, these visualizations can give her immediate information about key metrics, business performance through AI-powered explanations. And Sydney can drag and drop these insights into an email with just one click.
Let’s say that Sydney wants to learn more about the performance of each of eCalico’s warehouses and share that information with the head of quality assurance at eCalico. She can open her email, write a note to her coworker, and then embed visual insights into her email.
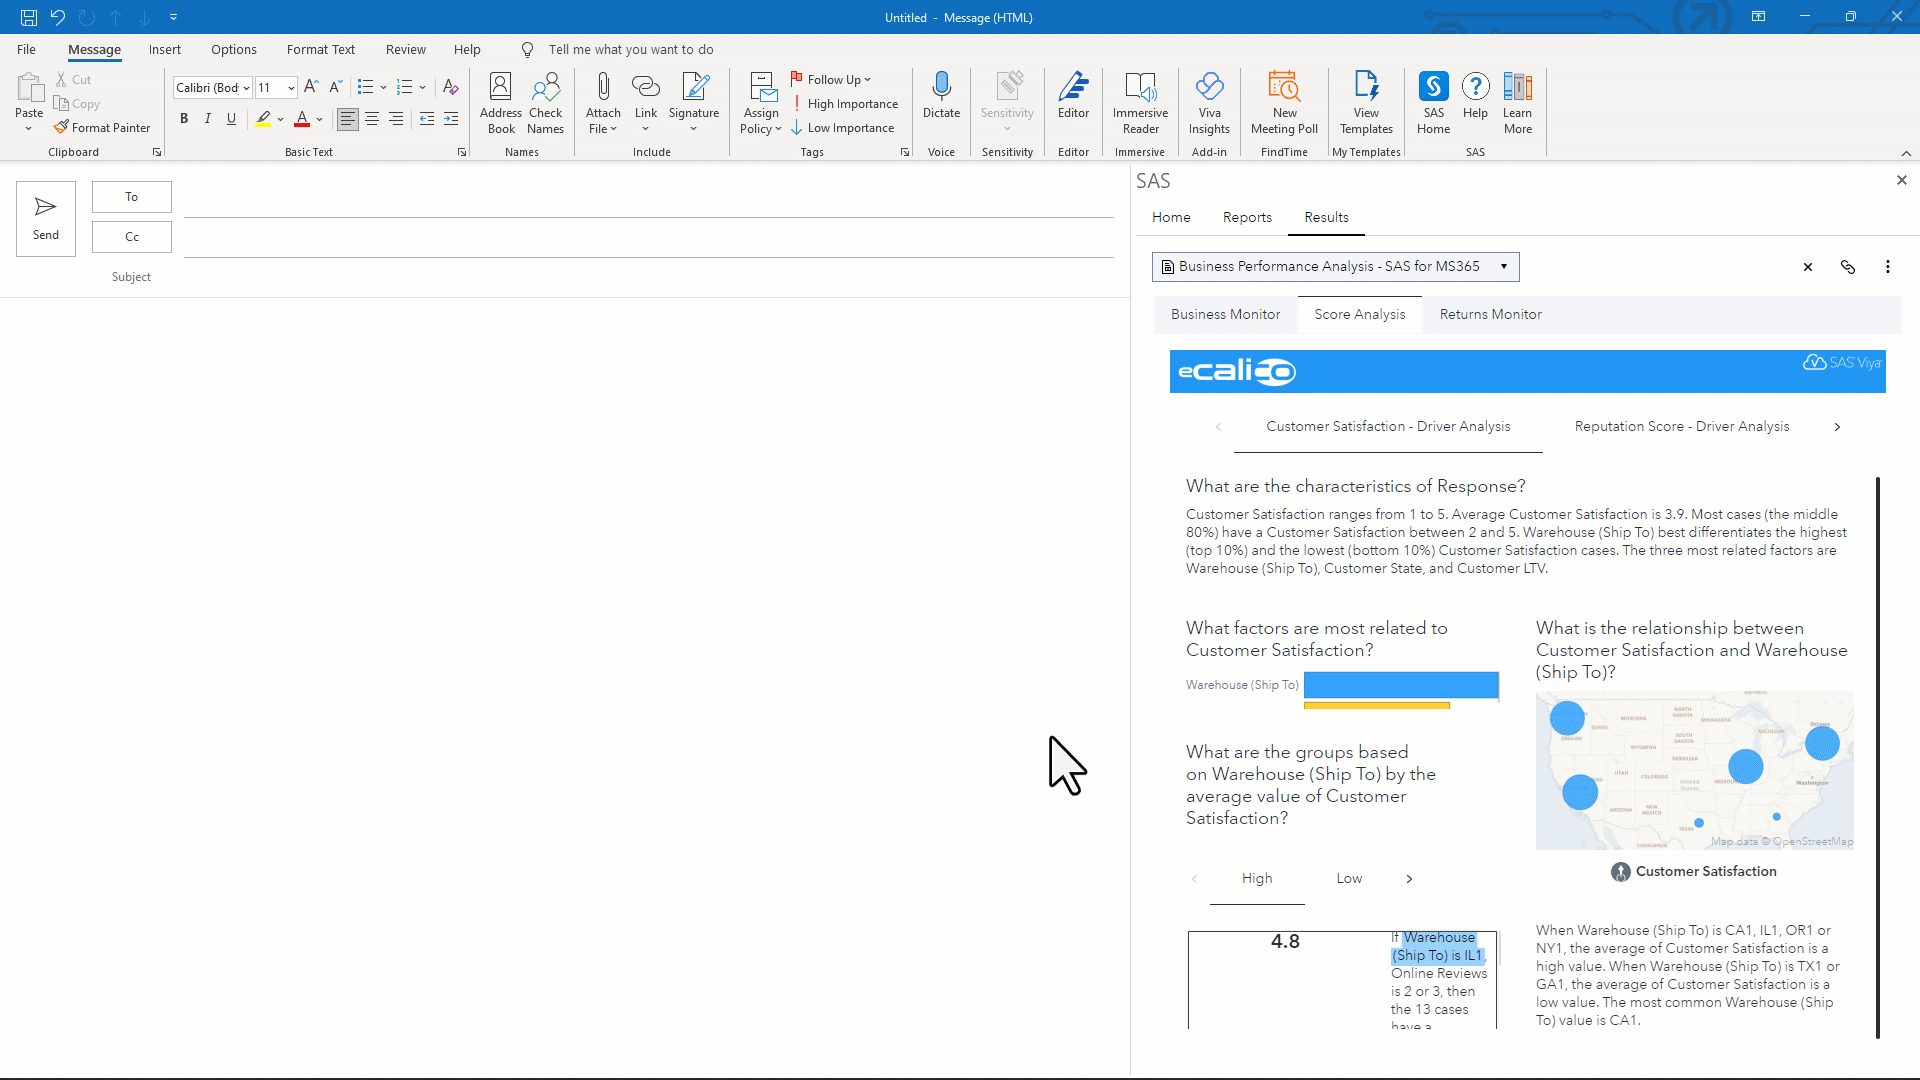
SAS Viya provides Sydney with some automated insights about the lowest performing warehouses – showing what the relationship is between customer success and each warehouse in an interactive map, natural language summary or chart.
These visualizations can help Sydney and her coworker learn what might be affecting the performance of warehouses by viewing the information in an understandable way and gives them the ability to choose how to visualize this data. For example, seeing how warehouses compare by location in a map and by gaining additional context powered by natural language explanations could be a great way for Sydney to learn the most from this data.
Now, Sydney and her coworker don’t have to try and make guesses about the best way to move forward or attempt to find quick insights from endless rows of data. They can easily act based on insights!
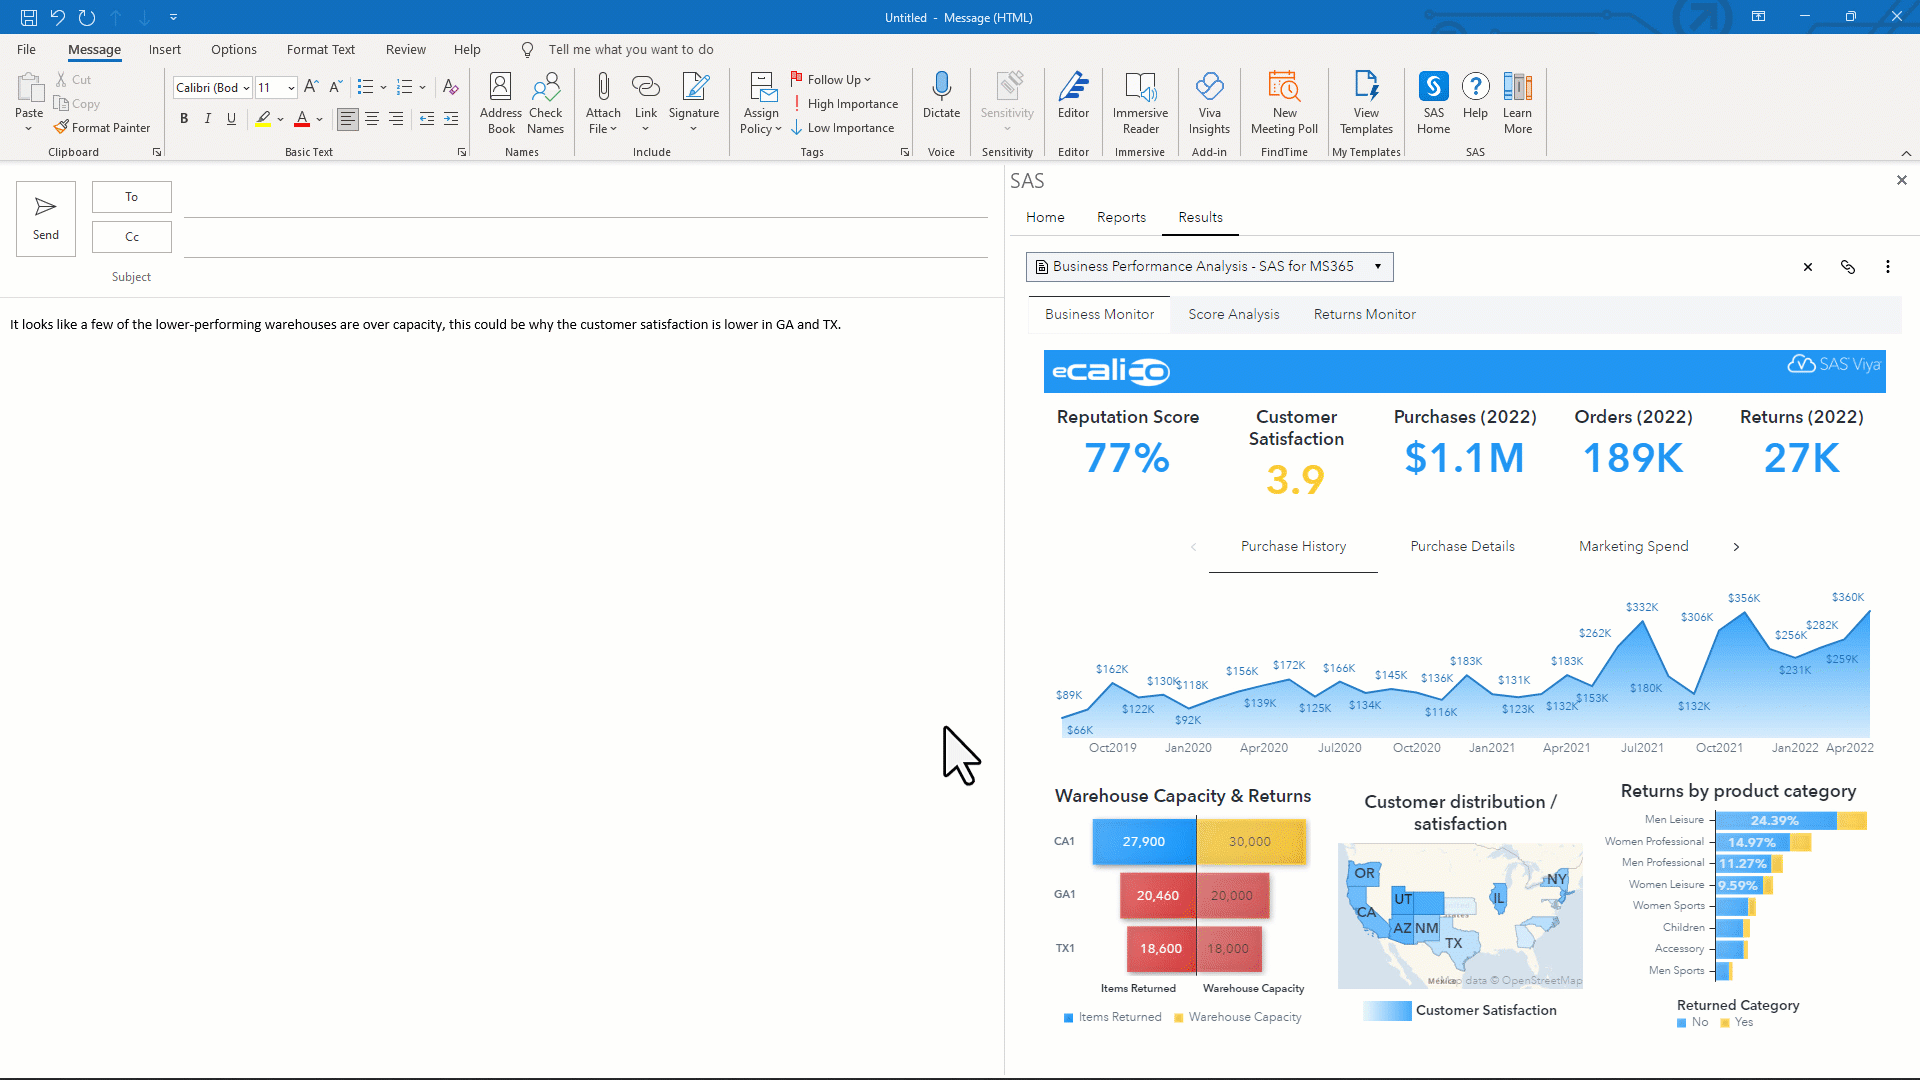
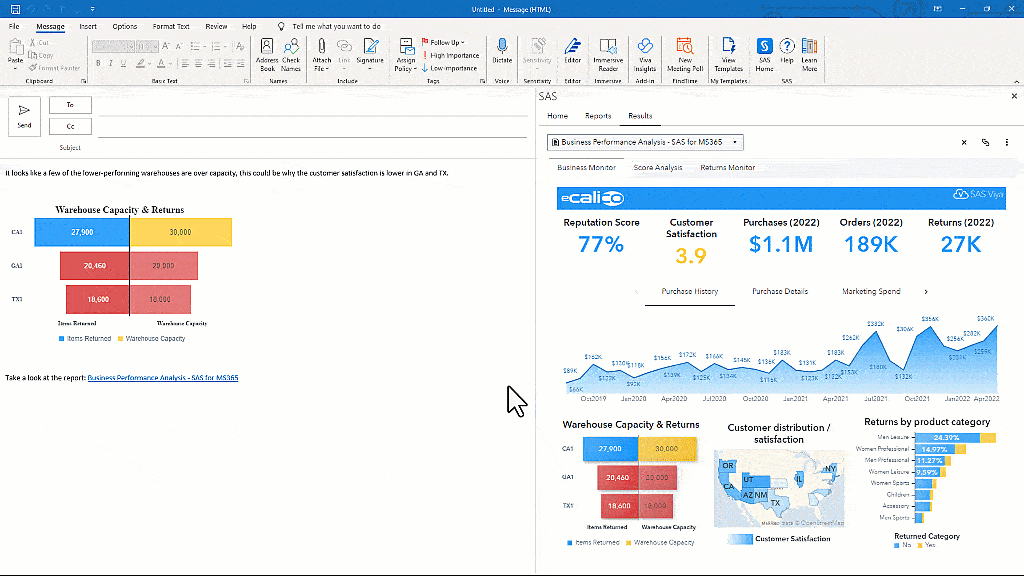
Another visualization in the dashboard compares the amount of returns with the warehouse capacity. It looks like GA and TX are over-capacity – could this be what’s affecting the performance?
These visualizations are interactive and give decision-makers like Sydney the ability to dive deeper without relying on an analyst. However, if they want more information, it’s easy to embed the visualization in question into the report and reach out over email to a business analyst!
With SAS for Microsoft 365 and Microsoft Outlook, Sydney and other decision-makers at eCalico will be able to quickly access valuable insights and share them to make informed decisions together.
Additionally, Sydney can feel confident that she can easily access insights no matter where she is by quickly exporting a report into a pdf – all from her email!
If Sydney had an all-hands on-site meeting coming up and she wants to share her findings with the team, exporting the report as a PDF lets her be prepared even when she’s working in an offline state.
If you want to learn more about how to use SAS visualizations in your email, take a look at: