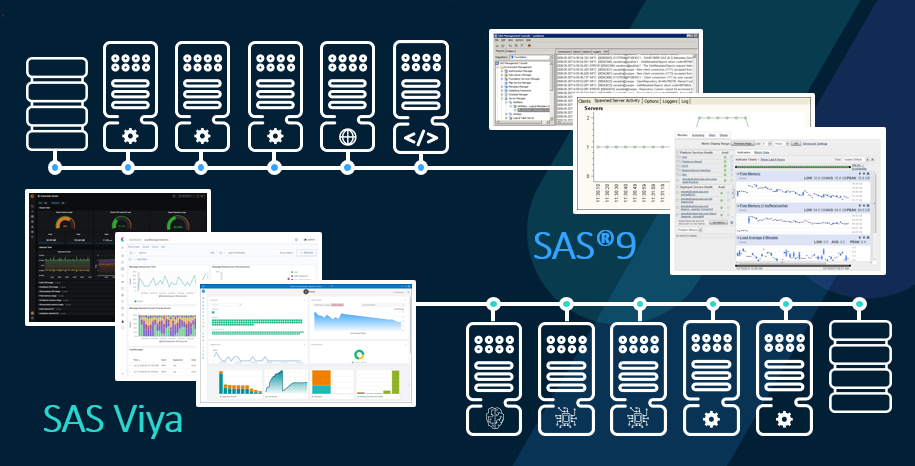
Think about what a modern implementation of SAS looks like for a customer. Programmers rely on robust environments to run the models and programs that answer business questions. These environments can be different for platforms like SAS® 9 and SAS® Viya®. They can be deployed across distributed servers, either on premises or using a cloud provider (sometimes both at the same time). These environments could even be set up across geographic regions for programmers across time zones. And we’re just thinking about the SAS servers—not counting data sources and third-party servers. All of these systems have their own suites of monitoring tools, which only show small slices of the big picture.
Observing all environments
SAS Enterprise Session Monitor aims to be the single point of contact for observing distributed systems. It brings unparalleled visibility to understanding environments using detailed system and application-level metrics for every session of SAS that is launched. This goes beyond traditional monitoring and into observability—aggregating, correlating, and analyzing a steady stream of constant data from systems to effectively troubleshoot or debug environments and sessions. Sessions in this case are those that come from SAS 9, SAS Viya, build servers, testing environments, and more. SAS Enterprise Session Monitor receives that data, displays it live in the tool, and stores the data for historical review in an embedded database.
SAS Enterprise Session Monitor is extensible and customizable: administrators can build patterns using regular expressions to track third-party sessions or custom in-house applications. If a process runs on a Windows or Linux server, SAS Enterprise Session Monitor can be configured to record metrics about it.
What metrics are collected?
SAS Enterprise Session Monitor collects and stores system metrics and logs, many monitoring tools do. Here is where things begin to get interesting, however: SAS Enterprise Session Monitor collects application-level metrics about SAS user sessions. The size of the SASWORK area is monitored and the amount of space in the CAS_DISK_CACHE. Users of SAS Enterprise Session Monitor are able see within DATA and PROC steps as code executes within SAS 9 or SAS Compute Server sessions. SAS Viya users can see the CAS actions that execute within their CAS sessions.
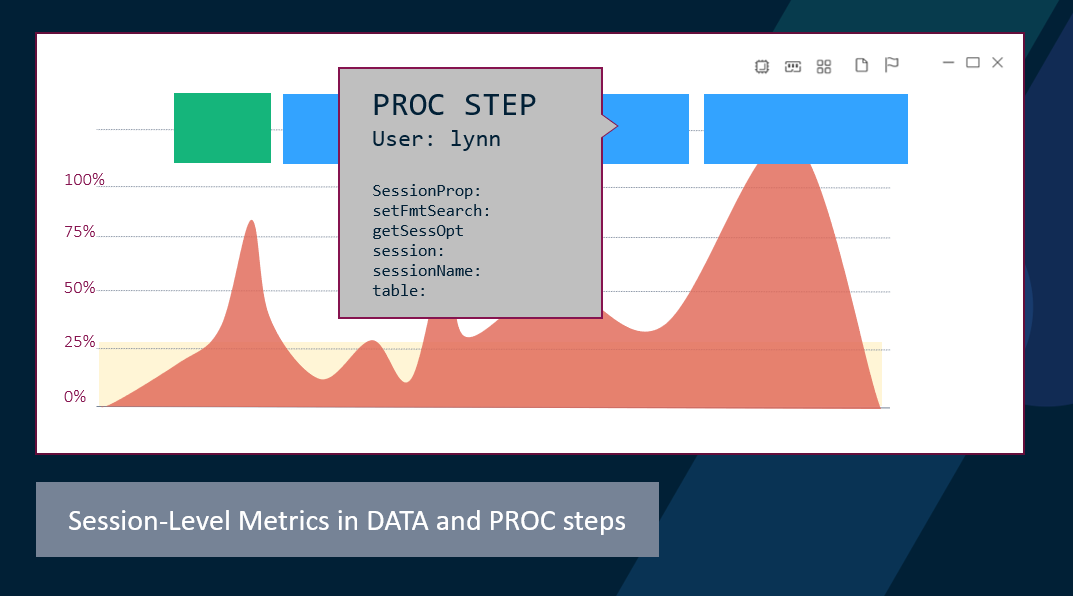
This information is presented in the form of spans which appear on a time-series graph along with session information such as CPU usage, memory usage and disk usage. This user activity is tracked for all user sessions, across all platforms. This code-level analysis can help to understand which SAS Procedures are used, which (and how frequently) datasets are opened, and which users are using the environments at different times.
Grand central admin-station
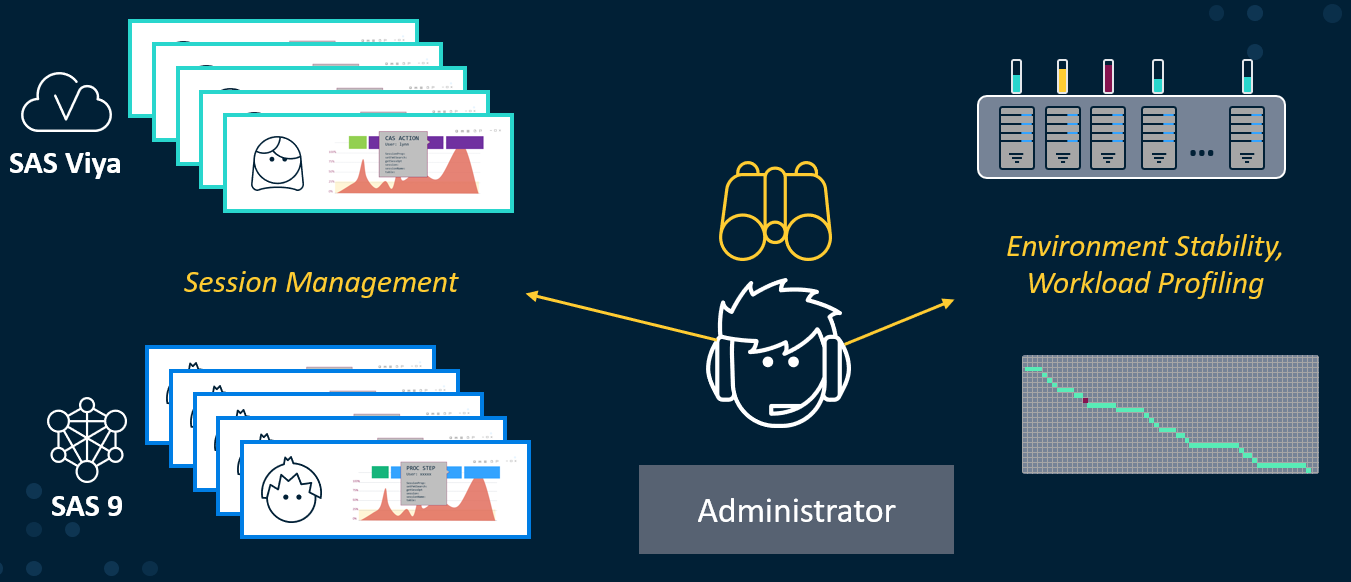
Administrators use SAS Enterprise Session Monitor to make sure their environments are stable and performant. Historical data can be used to profile workloads, charge back departments or help promote jobs between development, testing and production environments. Critical system resources are tracked to better understand when peak usage time is and to understand where resource constraints occur. This stored historical data can also be used for troubleshooting purposes, and all sessions and jobs can be searched for error events to help in problem analysis. Profiles of scheduled batch jobs can be graphed to see when large numbers of sequential programs could be redesigned to run in parallel. SAS Enterprise Session Monitor knows when distributed workloads should be linked together – in a SAS Grid or MPP CAS deployment.
Lower total cost of ownership
Administrators can use SAS Enterprise Session Monitor to accurately right-size their infrastructure with all the metrics collected — whether that is in the cloud or on premises. Accurate user counts and licensing can be determined for concurrent users in all distributed environments. And with accurate information coming in from distributed environments and multiple nodes, potential problems can be identified, and administrators can accelerate time to resolution and reduce system downtime on production or business-critical systems.
A drag-and-drop interface also allows for workloads from different teams to generate cost allocation rules so that costs can be charged back to departments depending on their usage of system resources. This allows for accurate tracking of cooperative resource sharing.
Empowering development teams

Developers (data scientists, analysts or programmers) use SAS Enterprise Session Monitor in real time to monitor or view progress of their code as it runs. This improves the developer experience and closes the feedback loop as they can see issues before something is promoted to production. Developers can use it to prioritize jobs and have insight into what is happening during their program execution.
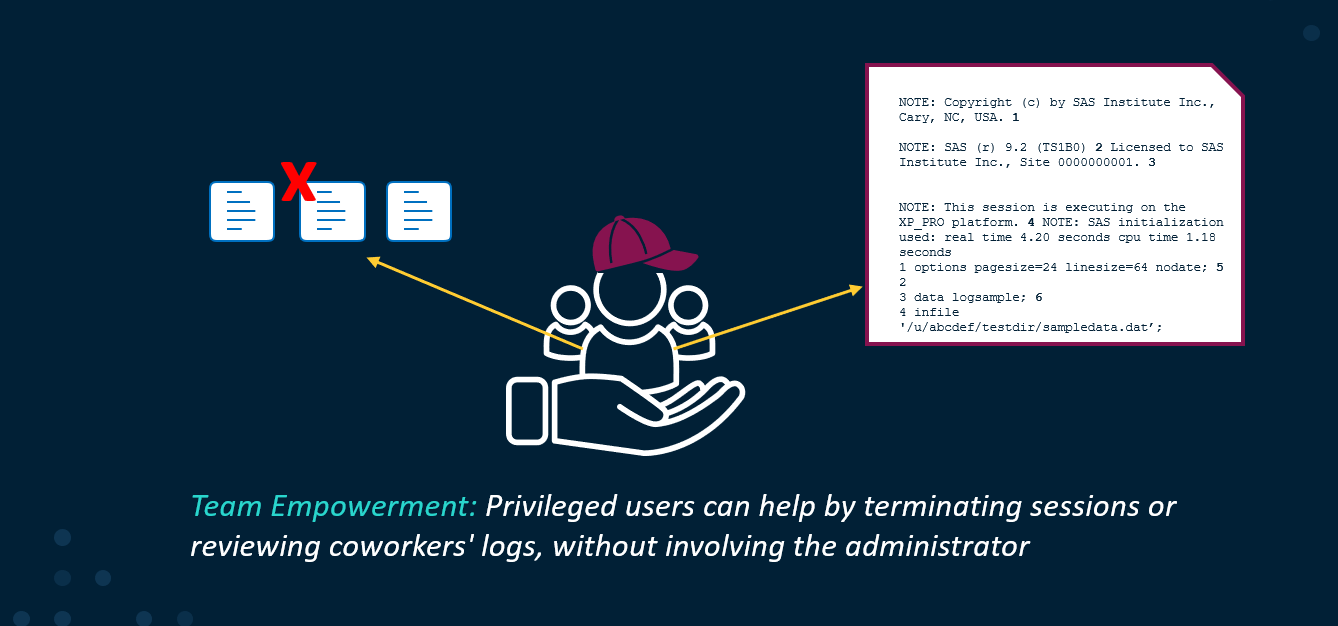
This empowers individual programmers, as well as teams of developers: teams can be configured to have access to their other team members’ sessions in SAS Enterprise Session Monitor. Privileged users can also be configured to allow team leads or power users to terminate sessions and view SAS program logs from the SAS Enterprise Session Monitor interface in a secure and audited way.
Other tidbits
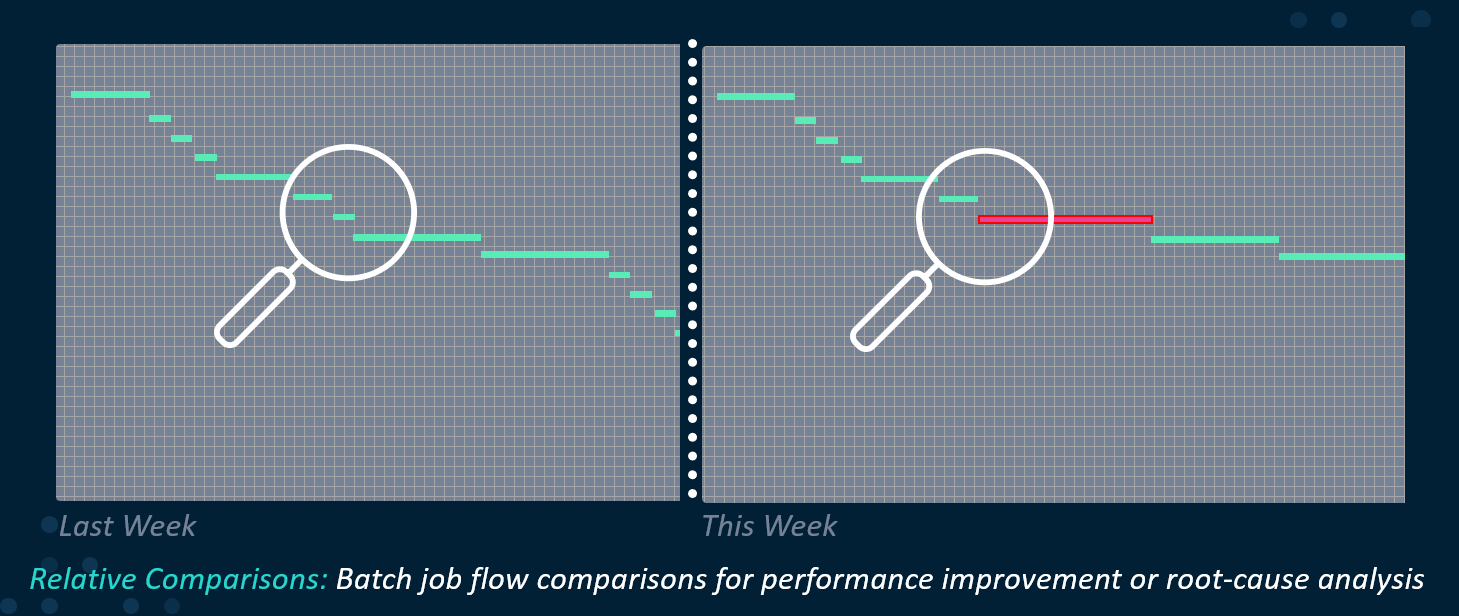
I mentioned how SAS Enterprise Session Monitor can analyze batch job flows, visualizing them into graphs that display total runtime and dependencies. Taking this a step further, the batch job flows can be viewed through Relative Comparisons — a feature where two defined time spans can be compared. Simply put, this means that one set of scheduled work can be compared to a previous run. This can give detailed information when evaluating whether to change a program or model, or when performing root-cause analysis of issues that impact the runtime of the scheduled work.

Lastly, developers can use real-time custom chart annotations that show up on the time-series graph. The %esmtag statement generates these annotations and can be used much like %put statements. These can be used as status checkpoints or observation counts, providing feedback in real time as the developer watches the program execute. These annotations are searchable in SAS Enterprise Session Monitor.
Summary
I hope you can feel my excitement about this tool and are able to see a few reasons to check this offering out — the potential for what can be monitored is almost endless. Here’s a quick recap:
-
• Enterprise Session Monitor provides visibility into many different types of SAS workloads. Servers and microservices across multiple SAS 9 and SAS Viya environments can be monitored in one place. Even third-party tools and data sources can be monitored with a little customization.
• Developers use it to close the feedback loop when developing new SAS programs.
• Administrators use it to solve platform issues—through session management, live data and historical data about SAS processes and system resources.