This post demonstrates how to rank data and how to place these ranks into roughly equal groups.
There are certain variables, such as annual salary, that are highly skewed. There are many who earn between $50,00 and $150,000, but some who earn millions or hundreds of millions of dollars a year. Trying to use variables like annual salary in statistical models typically violates assumptions of many popular statistical techniques. There are several solutions to the types of distribution problems we just described. One solution is to use a transformation like a logarithm of a value to "bring in the tail." Another solution is to substitute ranks for the original values. For example, the lowest salary would be assigned a rank of one, the next highest would be assigned a rank of two, and so forth. Another method is to place all of the values into a number of bins. For example, you could place all the salaries into ranges such that there would be approximately an equal number of values in each range.
You can use SAS Studio tasks to create ranks and, with a tiny bit of editing, create salary ranges.
Let's start with a data set called Salary that was created by a small program using a random number function. Shown below is a histogram and a smooth line representing 1,000 values of salary from this data set.
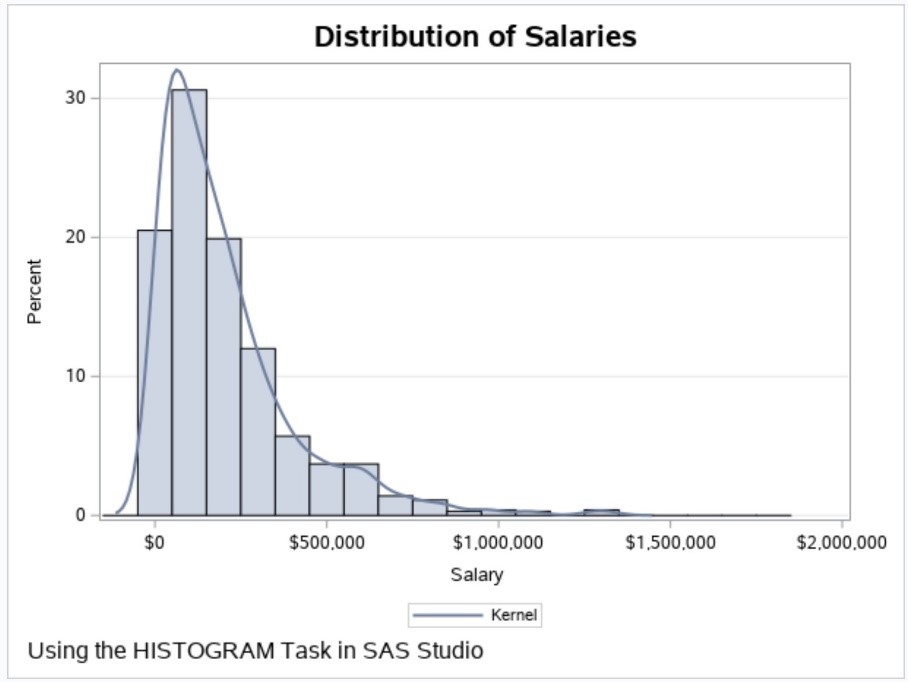
You see a grouping of values on the left side of the distribution and a few very high salaries in the right tail. For curious readers, here is the program that generated these data values.

The RAND function can generate quite a few distributions, such as uniform and normal. For this program, an exponential distribution was used.
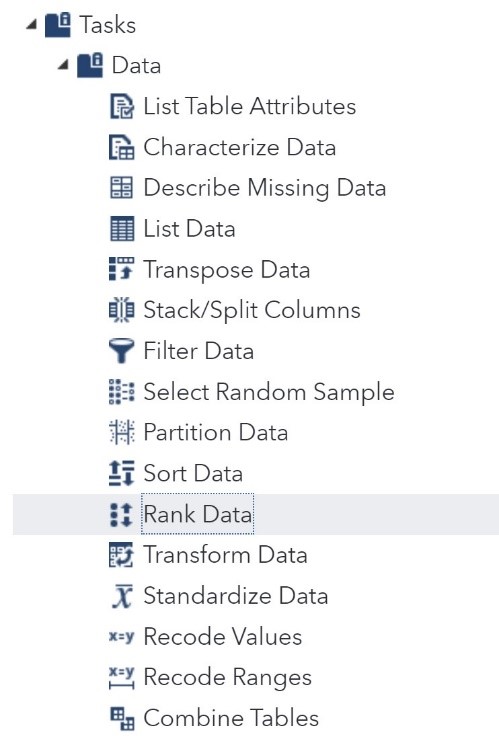
Suppose you plan to use yearly salary in a binary logistic regression model. Using the actual values from the Salary data set would not work well. Let's start out by creating a new variable that represents the rank of salary. In SAS Studio, this is easily done using the Rank Data task as one of the selections under the Data tab. You can see this in the figure below.
You choose the data set and variable to rank on the DATA tab, like this.
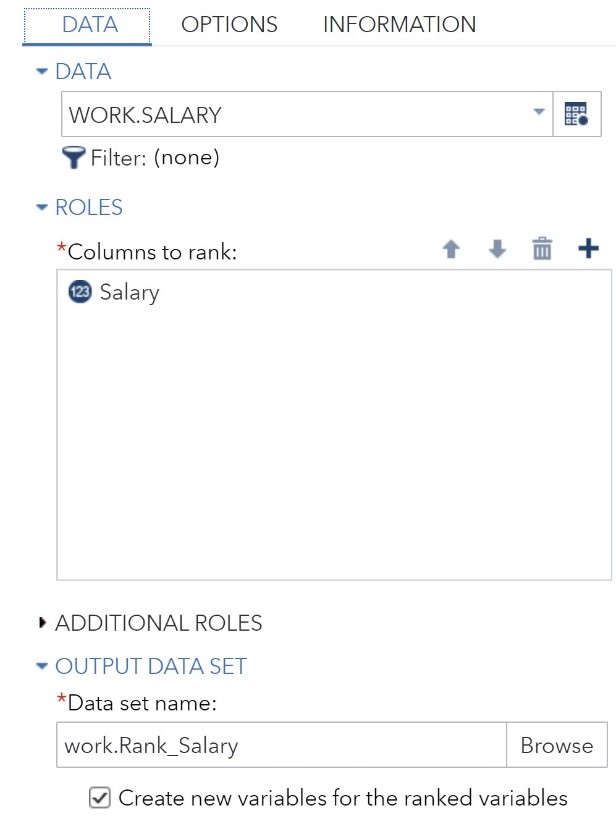
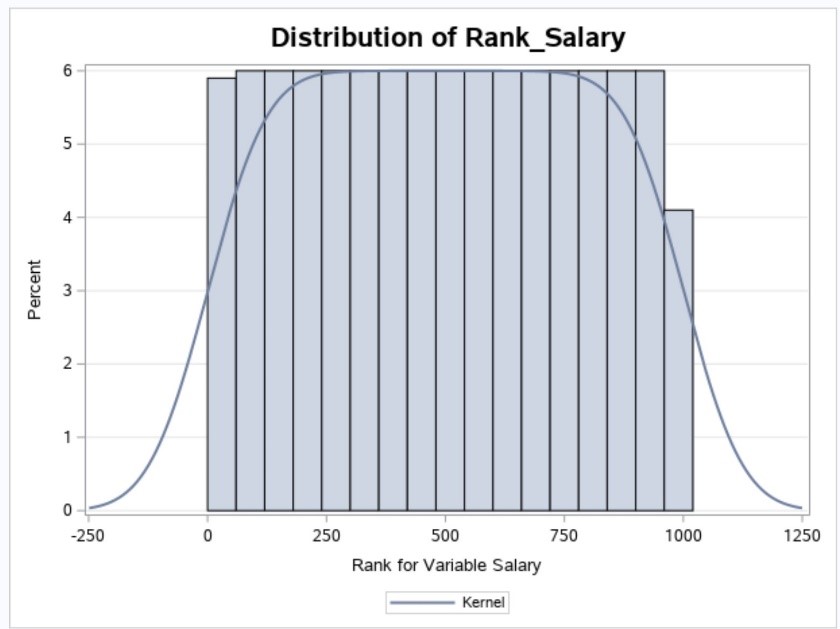
The Salary data set was selected, and the variable Salary was chosen as the variable (column) to rank. Finally, Rank_Salary was selected for the output data set name. A histogram of the ranks is, as you would expect, uniform ranging from one to 1,000 (see figure below).
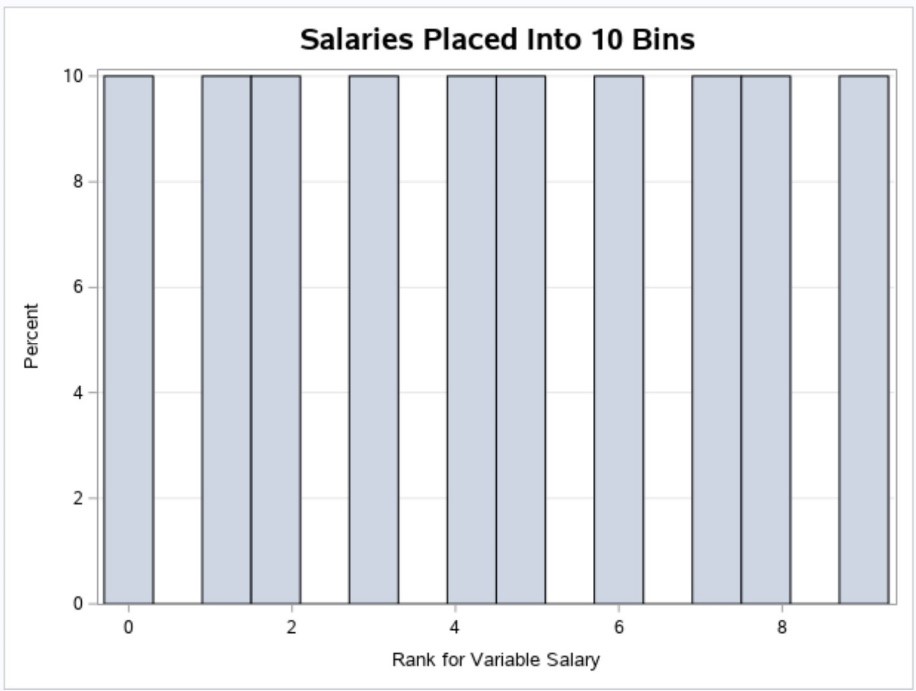
How can you place these 1,000 values into 10 bins? To do this, you click the CODE tab and then click Edit (circled in the figure below).
![]()
All you need to do is add the PROC RANK option Groups=10 to this program as shown next.
![]()
This option groups all the ranks into 10 groups. Below is a histogram of the variable Rank_Salary with the Groups= option included.
This new variable would work quite well in a logistic regression model or other types of regression.
If you found this blog post helpful, you might be interested in some of my books. As always, comments and/or suggestions are welcome.