Everyone knows that SAS has been helping programmers and coders build complex machine learning models and solve complex business problems for many years, but did you know that you can also now build machines learning models without a single line of code using SAS Viya?
SAS has been helping programmers and coders build complex machine learning models and solve complex business problems over many years.
Building on the vision and commitment to democratize analytics, SAS Viya offers multiple ways to support non-programmers and empowers people with no programming skills to get up and running quickly and build machine learning models. I touched on some of the ways this can be done via SAS Visual Analytics in my previous post on analytics for everyone with SAS Viya. In addition, SAS Viya also supports more advanced pipeline-based visual modeling via SAS Visual Data Mining and Machine Learning. The combination of these different tools within SAS Viya supporting a low-code/no-code approach to modeling makes SAS Viya an incredibly flexible and powerful analytics platform that can help drive analytics usage and adoption throughout an organization.
As analytics and machine learning become more pervasive, an analytics platform that supports a low-code/no-code approach can get more people involved, drive ongoing innovations, and ultimately accelerate digital transformation throughout an organization.
Speed
I have met my fair share of coding wizards who blew me away with their ability to build models using keyboards with lightning speed. But when it comes to being able to quickly get an idea into a model and generate all the assessment statistics and charts, there is nothing quite like a visual approach to building machine learning models.
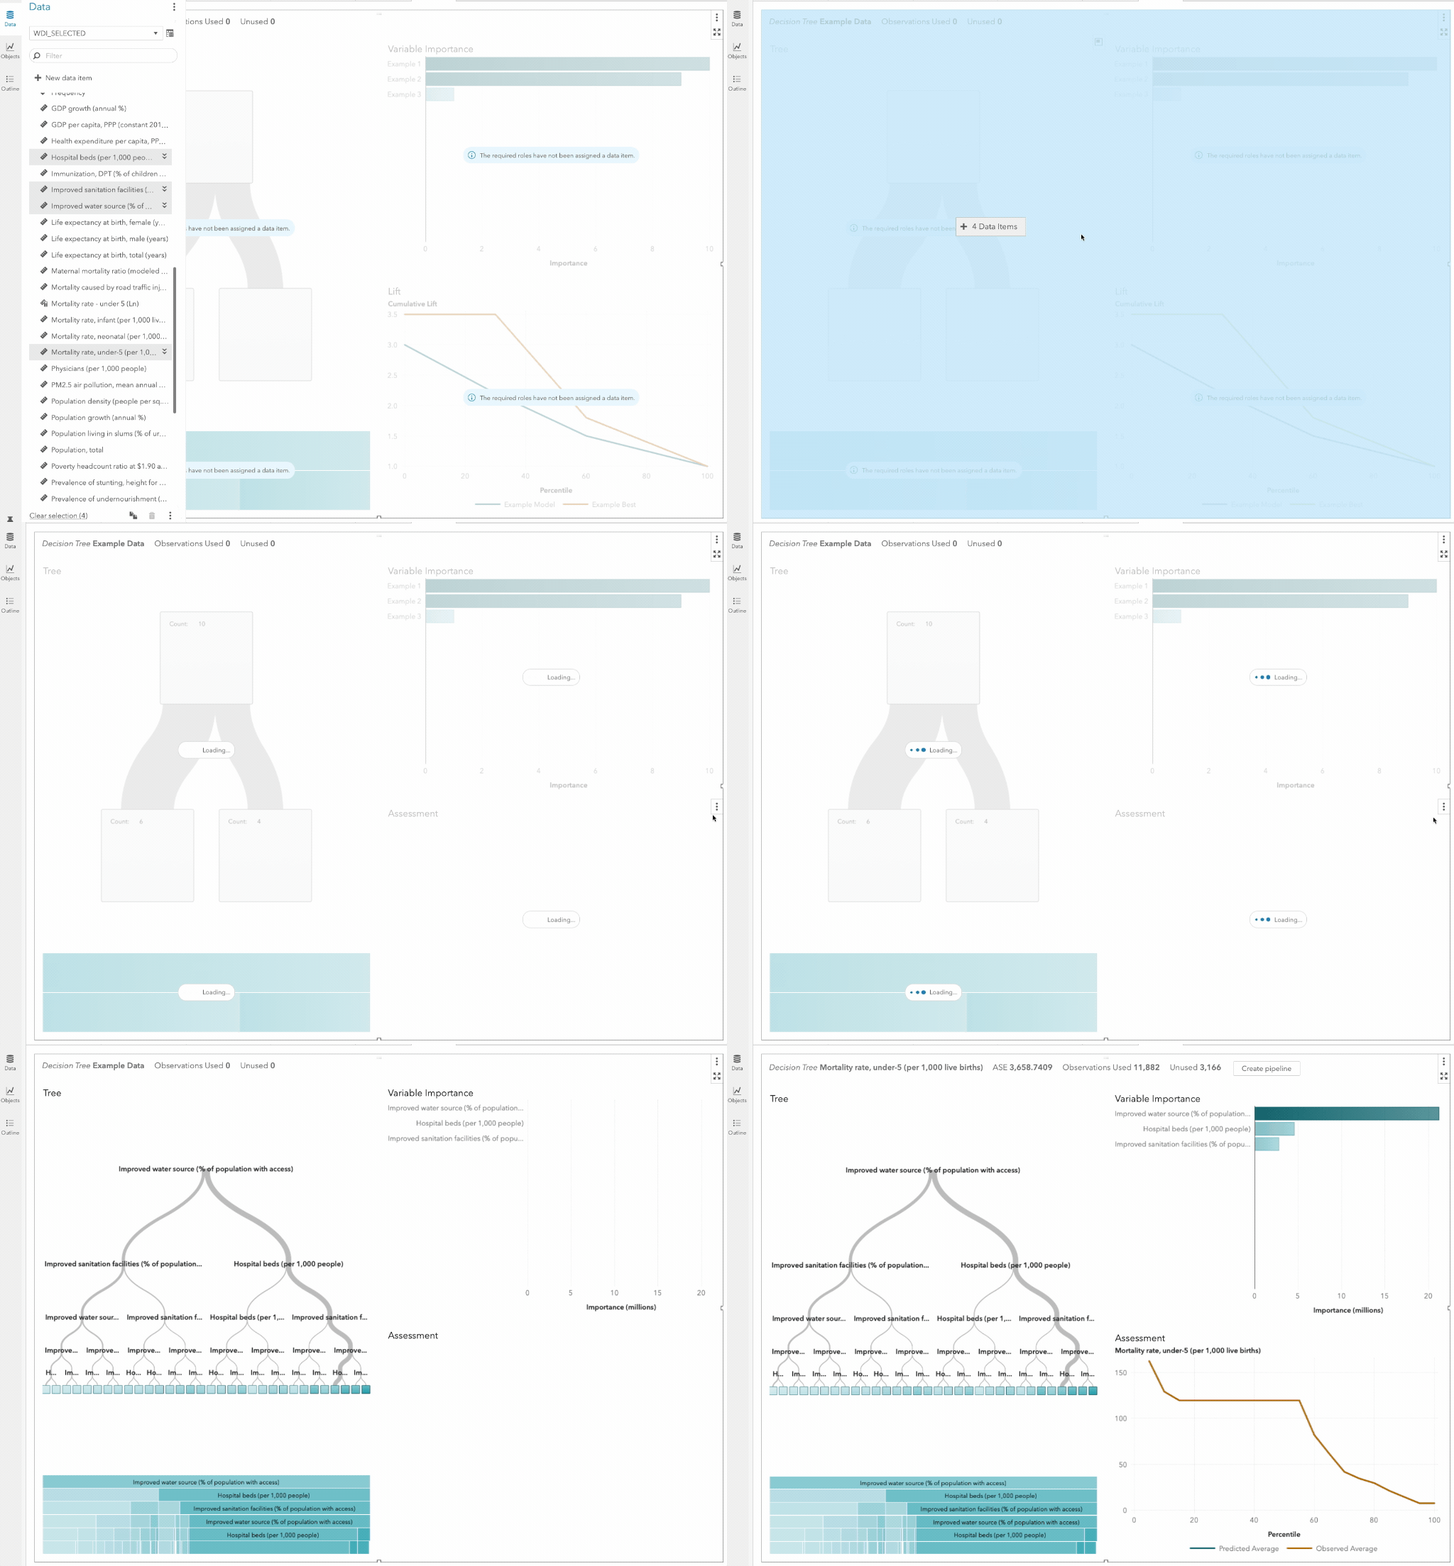
In SAS Viya, you can build a decision tree model literally just by dragging and dropping the relevant variables onto the canvas as shown in the animated screen flow below.

In this case, we were able to quickly build a decision tree model that predicts child mortality rates around the world. Not only do we get the decision tree in all its graphics glory (on the left-hand side of the image), we also get the overall model fit measure (Average Standard Error in this case), a variable importance chart, as well as a lift chart all without having to enter a single line of code in under 5 seconds!
You also get a bunch of detailed statistical outputs, including a detailed node statistics table without having to do anything extra. This is useful for when you need to review the distribution and characteristics of specific nodes when using the decision tree.

What’s more, you can leverage the same drag-and-drop paradigm to quickly tune the model. In our case, you can do simple modifications like adding a new variable by simply dragging a new data item onto the canvas or more complex techniques like manually splitting or pruning a node just by clicking and selecting a node on the canvas. The whole model and visualization refreshes instantly as you make changes, and you get instant feedback on the outputs of your tuning actions, which can help drive rapid iteration and idea testing.
Governance and collaboration
A graphical and components-based approach to modeling also has the added benefits of providing a stronger level of governance and fostering collaboration. Building machine learning model is often a team sport, and the ability to share and reuse models easily can dramatically reduce the cost and effort involved in building and maintaining models.
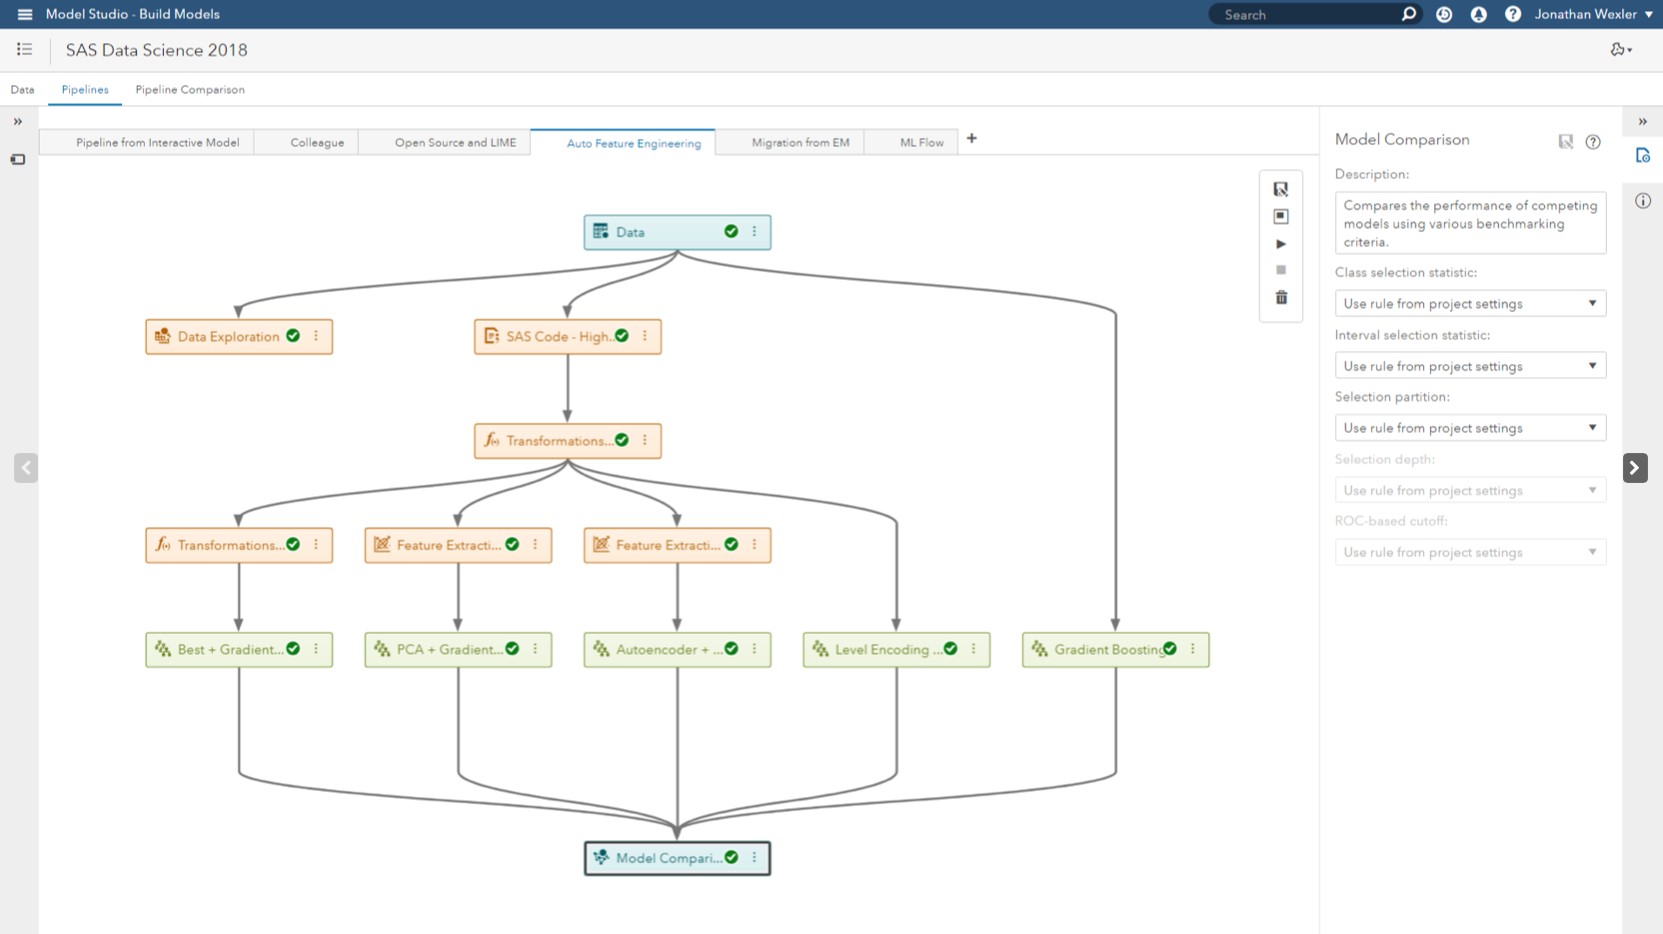
SAS Visual Data Mining and Machine Learning enables users to build complex, enterprise-grade pipeline models that support sophisticated variable selection, feature engineering techniques, as well as model comparison processes all within a single, easy-to-understand, pipeline-based design framework.

The graphical, pipeline-based modeling framework within SAS Visual Data Mining and Machine Learning leverages common components, supports self-documentation, and allows users to leverage a template-based approach to building and sharing machine learning models quickly.
More importantly, as a new user or team member who needs to review, tune or reuse someone else’s model, it is much easier and quicker to understand the design and intent of the various components of a pipeline model and make the needed changes.
It is much easier and quicker to understand the design and intent of the various components of a pipeline model.
Communication and storytelling
Finally, and perhaps most importantly, a graphical, low-code/no-code approach to building machine learning models makes it much easier to communicate both the intent and potential impact of the model. Figures and numbers represent facts, but narratives and stories convey emotion and build connections. The visual modeling approaches supported by SAS Viya enable you to tell compelling stories, share powerful ideas, and inspire valuable actions.
SAS Viya enables you to make changes and apply filters on the fly within its various visual modeling environments. With the model training process and model outputs all represented visually, it makes it extremely easy to discuss business scenarios, test hypotheses, and test modeling strategies and approaches, even with people without a deep machine learning background.
There is no question that a programmatic approach to building machine learning models offers the ultimate power and flexibility and enables data scientist to build the most complex and advanced machine learning models. But when it comes to speed, governance, and communications, a graphical, low-code/no-code approach to building machine learning definitely has a lot to offer.
To learn more about a low-code/no-code approach to building machine learning models using SAS Viya, check out my book Smart Data Discovery Using SAS® Viya®.

1 Comment
Thanks, Felix! An excellent presentation of the compelling value of visualization and modeling tools of today.
(On my website I mention the first econometric model I ever built in 1987, which was for a state regulatory filing using SAS v5, had four cross sections, 36 months of demand in each cross section, and took about four weeks to complete, from manual data collection all the way through final model validation and writing of documentation and testimony. It was a pooled cross-sectional times series model, using linear regression with a lagged dependent price variable, plus other explanatory variables. This one model and its related validation analytics ran in about three minutes.)