In the article Serverless functions and SAS Viya - a good match I discussed using serverless functions to deliver SAS Viya applications. Ignoring all the buzz words, a serverless function boils down to a set of REST APIs. So, if you tried the example you are now a REST API developer 🙂 .
The serverless function allowed the application developer to do the following:
Define what the end user must supply to the function. A good application developer will try to make the request simple and easy to understand.
Return to the end user a response easily consumed by the client's program. Again, a good application developer would make sure the response satisfies most common usage scenarios.
Hide all the details of what it took to satisfy the users request.
This blog discusses using GraphQL to achieve the same goals. First, I will briefly discuss GraphQL, where it fits in with SAS Viya application integration, and how to create GraphQL-based applications. I also provide a series of examples based on real-world scenarios.
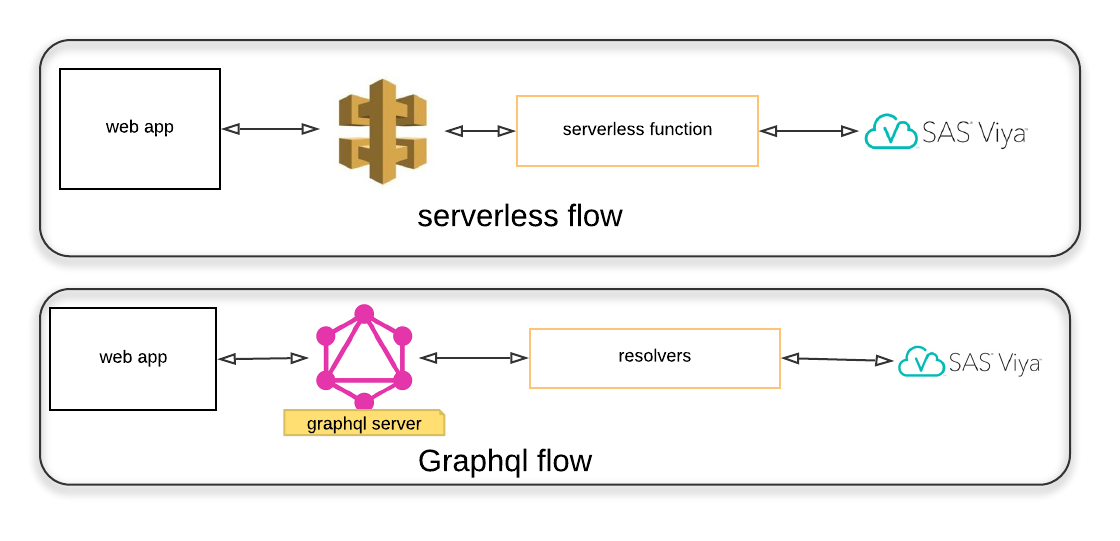
The images below display a high level comparison of the approaches between serverless and GraphQL. serverless and GraphQL process flow
Steps in the GraphQL flow
A GraphQL server replaces the AWS API Gateway.
The code that runs in the GraphQL server is referred to as "resolvers" - as the name implies, resolvers are used by the GraphQL server to execute user requests.
The resolvers make the necessary REST API calls to the SAS Viya Server.
All of the code in this article resides in the restaf-graphql-demo GitHub repository. If you are not familiar with GraphQL please review the links at the end of this article before proceeding.
Why GraphQL?
Some smart folks at Facebook created GraphQL to solve problems they encountered using standard REST APIs. Companies like Github, Netflix, PayPal, The New York Times and many others are adopting GraphQL.
Some of the key motivators are:
Users define and request what they need, following exact specifications
A convenient way to front existing systems (REST-based or not) and databases with a Developer Experience friendly API
Returning only the requested information reduces the data transferred - important for reducing network traffic
GraphQL is less "chatty" - where REST API will requires multiple trips to the server, GraphQL can accomplish the same task in one round trip
Why GraphQL for SAS Viya application developers?
While the general GraphQL characteristics listed above are important, GraphQL is also a useful technology for developers creating applications integrated with SAS Viya.
GraphQL is a ready-made vehicle for SAS users to deliver their applications as the next generation "stored process" developed with the data step+procedures, CAS Language (CASL) statements, custom CASL actions and SAS REST APIs.
GraphQL is a great way for front-end and back-end developers to communicate.
Developers can code to an agreed contract as specified by the GraphQL schema.
Front-end developers can be confident what they get is exactly what they asked for.
Writing the GraphQL-based applications
The GraphQL queries used in this article are examples for demonstration purposes only and not "standards or strict guidelines" to follow. The code in the GitHub repository and the examples outlined below will help you jump-start your excellent adventure in GraphQL and SAS Viya applications.
The high-level steps for writing an application using GraphQL query are:
SAS Viya Side
SAS programmers, data analysts and data scientists develop their intellectual protocol with SAS programs written with SAS procedures, CAS Actions, data step and CASL language.
Server Side
Build the GraphQL schema and define the queries (see this for examples). In relation to SAS Viya, the schema describes the input and output of the SAS programs.
Make sure you have discussed this with the UI developers and the SAS programmers
Write the resolvers - GraphQL server will call this code to resolve the requests by the user (see this for examples).
Register both of these with the GraphQL server.
The project uses restaf-graphql-server. This server is a wrapper around Apollo's GraphQL Server and hapijs. The restaf-graphql-server handles authentication and exposes the GraphQL server. The server uses restaf to make the necessary REST API calls to SAS Viya.
Client Side
You can build the web apps in the normal way with these characteristics:
These apps will call a single end point (/graphql) with a POST method.
The payload is the GraphQL query
The response will match the query and are easily accessible
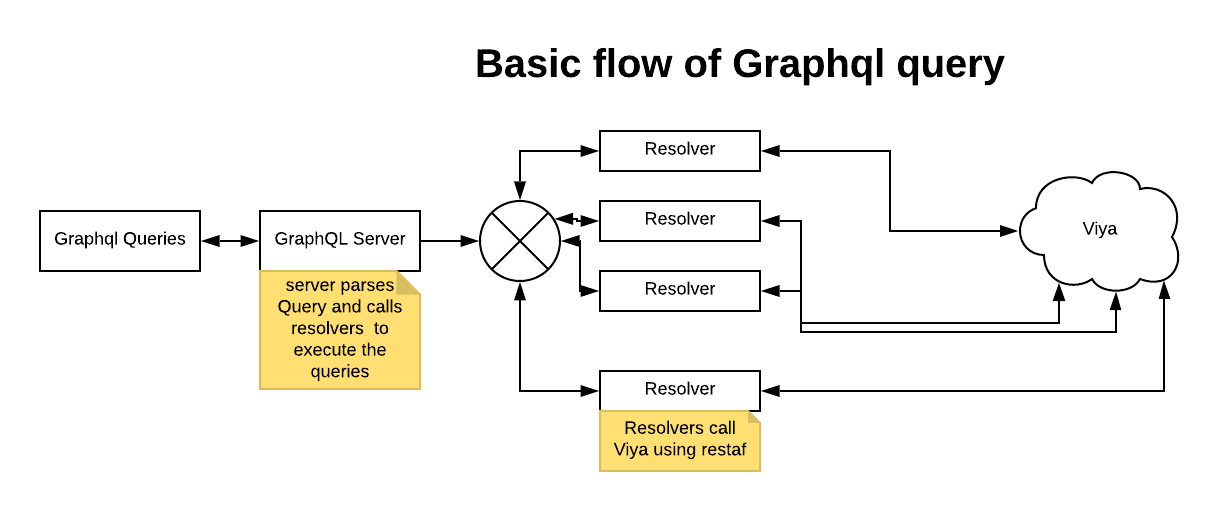
The image below shows the flow of a GraphQL-based application. User's queries are sent to the GraphQL server. The server parses the queries and calls the appropriate resolver (your code) to obtain the values for the requested fields. In this project the resolvers use restaf to make REST API calls to SAS Viya.
GraphQL-based application process flow
The rest of the blog discusses a few examples. All these examples are available in the repository. I chose to write the examples using JavaScript since it is one of the languages I am familiar with and can write reasonably decent code in. You can develop GraphQL-based SAS Viya applications in all the popular languages of today.
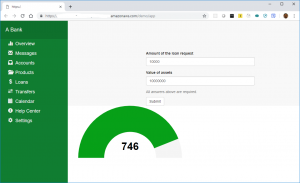
In this example, a data scientist working for a bank, has created a model to score a loan applicant's eligibility. The scientist outlines the following requirements:
The user can only enter the desired loan amount and their current assets. All the other parameters needed for scoring have set values. All the values must be passed to the SAS code as a dictionary named _args_.
Since the scientist wants to run A/B experiments the location and name of the scoring model's astore must be passed in as dictionary named _appEnv_.
The code developed by the data scientist is below. The score returns as a dictionary.
{score= <value>}
SAS Code
I wrote the SAS program in this example in CASL.
loadactionset "astore";

  /* convert arguments to a cas table */
/* _args_  and _appEnv_ are  generated by caslBase - see caslBase for details */

/* CASL function to convert a dictionary to a cas table  see lib/argsToTable.js for details*/
argsToTable(_args_, 'casuser', 'INPUTDATA' );

/* score */
action astore.score /
    table  = { caslib= 'casuser', name = 'INPUTDATA' }
    rstore = { caslib= _appEnv_.astore.caslib,  name=_appEnv_.astore.name }
    casout  = { caslib = 'casuser', name = 'OUTPUTDATA' replace= TRUE};

/* fetch results */
action table.fetch r = result /
    table = {  caslib = 'casuser' name = 'INPUTDATA' } ;

/* extract the score and send it as a dictionary */
score = result.Fetch[1].P_BAD;
scoreo= {score= score};
send_response(scoreo);
Key points to note:
The resolver creates and prepends two CASL dictionaries _args_ and _appEnv_.
The CASL program returns the result using the send_response function.
One of the cool things is that CASL allows the programmer to customize the returned value. In this example the score extracts into a dictionary.
Schema
Based on the requirement the schema is as shown below:
type Query {
   scoreLoan(amount: Int assets: Int) : Float
Key Point:
The two values the user specifies are defined as the filter parameters to the query.
Application
scoreLoanKey point:
The user enters the two values the data scientist requires.
Client code
async function runScore(amount, assets){
    let payload = {
        query: `query {
            scoreLoan(amount: ${amount} assets: ${assets} )
        }`
    }

    let config = {
        url            : host + '/graphql',
        withCredentials: true,
        method         : 'POST',
        data           : payload
    }

    let r = await axios(config);
    return r.data.data.scoreLoan;
}
Key points:
The payload is the GraphQL query.
I use the POST method.
The end point is /graphql - this is the only endpoint the application will use.
The response is available as r.data.data.scoreLoan
Note the simplicity of the client code to access the GraphQL server and obtain the results.
Resolver
let caslBase = require('../lib/caslBase');

module.exports = async function scoreLoan (_, args, context) {
    let { store } = context;
    let input = {
        JOB    : 'J1',
        CLAGE  : 100,
        CLNO   : 20,
        DEBTINC: 20,
        DELINQ : 2,
        DEROG  : 0,
        MORTDUE: 4000,
        NINQ   : 1,
        YOJ    : 10
    };

    input.LOAN  = args.amount;
    input.VALUE = args.assets;

    let env = {
        astore: {
            caslib: 'Public',
            name  : 'GRADIENT_BOOSTING___BAD_2'
        }
    }
    let result = await caslBase(store,['argsToTable.casl', 'score.casl'], input, env);
    let score = result.items('results', 'score');

    return score;

}
Key points:
As required, the default values for the other parameters are added to the user input.
The resolver contains the location and name of the model.
The names of the SAS code are passed to caslBase - this allows the code to read the SAS code from a repository.
The caslBase function calls the jsonToDict to convert the json parameters to CASL dictionary and passes it on to CAS along with the code.
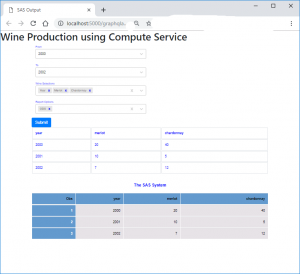
The TwoBit winery management wants a simple report to view the production of different wines by year. They want to be able to pick the year range and the wines in which they are interested. The data shown below is for the TwoBit Winery. The goal is to query for selected wines and filter on years.
The data for the winery is listed below.
Obs
year
cabernet
merlot
pinot
chardonnay
twobit
1
2000
10
20
30
40
50
2
2001
5
10
15
5
0
3
2002
6
7
11
12
13
4
2003
5
8
0
0
50
5
2004
11
5
7
8
100
6
2005
1
1
0
0
1000
7
2006
0
0
0
0
3000
SAS Code
The SAS experts at the company created the following SAS code to meet management's request. Note that for demo purposes the wine data is created inline.
data wineList;
 input year cabernet merlot pinot chardonnay twobit ;
 cards;
 2000 10 20 30 40 50
 2001 5 10 15 5 0
 2002 6 7 11 12 13
 2003 5 8 0 0 50
 2004 11 5 7 8 100
 2005 1  1 0 0 1000
 2006 0 0 0 0 3000
;;;;
run;
/* _selections_ macro was generated in src/lib/getSelections function.
data wine ;
    set winelist( where= (year GE &from && year LE &to));
    keep &_selections_;
    run;
ods html style=barrettsblue;
    proc print data=wine;run;
ods html close;run ;
Key points to note:
The code requires macro variables &from, &to and &_selections_ be set before this code executes.
The name of the returned table is wine.
Schema
type Query{
wineProduction(from: Int, to: Int): WineProduction
}

type WineProduction {
"""
An array containing wine production
"""
wines : [WineList]

"""
ODS output and Log output
"""
report: SASResults
}

type WineList {
year : Int
cabernet : Int
merlot : Int
pinot : Int
chardonnay: Int
twobit : Int
}

type WineProductionCas {
wines : [WineList]
}
type SASResults {
        """
        ODS output from the server
        """
        ods: String
        """
        Log output from the server
        """
        log: String

    }
Key points:
As required, the year range is specified as filters for the query.
As required, the user can pick the wines in which they are interested.
Application
The application is shown below.
Client code
The relevant client code is shown below (see this in the repository for the full program).
 let gqString = `query userQuery($from: Int, $to: Int) {
                           results: wineProduction(from: $from to: $to) {
                              wines {
                                  ${wineList}
                                }
                                ${reportList}
                             }
                            }`;
        let payload = {
            url   : host + '/graphql',
            method: 'POST',
            data: {
                query: gqString,
                variables: {
                    from: fromYear.value,
                    to  : toYear.value
                }
            }
        }
        setReportValues(null);
        setResultValues(null);
        axios(payload)
         .then ( r => {
            let res = r.data.data.results;
           // Simple to extract the results
            setResultValues(res.wines);
            if (res.report != null ) {
                setReportValues(res.report);
            }

         })
         .catch( e => alert(e))
    }
})
Key points:
The GraphQL query string is sent as the payload (wineList and reportList are strings computed earlier in the program based on user selection).
The endpoint is again /graphql with a POST method.
This snippet also shows the preferred way to send the filter values.
Resolver
The root resolver is shown below.
let getProgram    = require('../lib/getProgram');
let getSelections = require('../lib/getSelections');
let spBase        = require('../lib/spBase');

module.exports = async function wineProduction (_, args, context, info){
    let {store} = context;

<span style="font-size: 14px;">   // read source - reads in the sas program</span>
    let src = await getProgram(store, ['wines.sas']);

    // update args with the wine list specified by the user
    let selections = getSelections(info, 'wines', args);

   // execute the sas code with compute server and get results
    let resultSummary = await spBase(store, selections.args, src);

    // resultSummary is now passed to the resolvers for wines and results fields.
    return resultSummary;
}
Key points:
Code from the GitHub repo uses winelist.js to resolve the list of wines.
Another common use case is retrieving information about reports developed with SAS Visual Analytics. The GraphQL query to get the list of reports, who edited it last and when is shown below. This example uses the reports REST API.
Schema
{
    reports {
        name
        modifiedBy
        modifiedOn
   }
}
Creating a UI for this is a challenge exercise for the reader (meaning I did not get around to writing it 🙂 ). The returned results look something like this:
{
  "data": {
    "report": {
      "url": "http://superuser.com/?reportUri=/reports/reports/ecec39ad-994f-4055-8e40-4360f410bc6e...",
      "image: {the svg of the image}
    }
}
Resolver
There are 3 resolvers associated with this query, the root resolver and resolvers for image and url. For the sake of brevity, I will not review those here. please visit the code in the repository.
In conclusion
The examples above cover some basic scenarios for SAS Viya applications.
Using CAS actions
Using traditional data step and procs
Obtaining ODS output
Working with SAS Visual Analytics
The simplicity of the client code and the resolvers are what makes GraphQL attractive for writing SAS Viya applications. You can also exploit other features in SAS Viya using the same pattern. Further, you can use the examples in this repository to easily customize your own use cases. The resolvers and helper functions are written to be reusable with minimal effort. The instructions are in the README file in the repository. If you create interesting schema and resolvers for SAS Viya, please share them with the SAS user community.
Opinion
Like all new technologies GraphQL has its proponents and detractors. Also, many people get caught in the low-value arguments about GraphQL being better or worse than REST. I personally do not follow these discussions since you should use the best tool for the job.
I find GraphQL most attractive when developing a back-end for SAS Viya applications. Both front and back-end developers will benefit from the clear definition of the schema. Having well supported GraphQL servers by Apollo and Facebook makes it easier to adopt GraphQL.
Useful links
There are a growing number of resources from which to learn and model. Below is small starter list.
Deva Kumar has been with SAS Institute since 1982. His current focus is on developing applications with SAS Viya. The technologies he is focused on are: REST API, Graphql and serverless functions.


1 Comment
Nice work!