Interested in making business decisions with big data analytics? Our Wiley SAS Business Series book Profit Driven Business Analytics: A Practitioner’s Guide to Transforming Big Data into Added Value by Bart Baesens, Wouter Verbeke, and Cristian Danilo Bravo Roman has just the information you need to learn how to use SAS to make data and analytics decision-making a part of your core business model!
This book combines the authorial team’s worldwide consulting experience and high-quality research to open up a road map to handling data, optimizing data analytics for specific companies, and continuously evaluating and improving the entire process.
In the following excerpt from their book, the authors describe a value-centric strategy for using analytics to heighten the accuracy of your enterprise decisions:
“'Data is the new oil' is a popular quote pinpointing the increasing value of data and — to our liking — accurately characterizes data as raw material. Data are to be seen as an input or basic resource needing further processing before actually being of use.”
Analytics process model
 In our book, we introduce the analytics process model that describes the iterative chain of processing steps involved in turning data into information or decisions, which is quite similar actually to an oil refinery process. Note the subtle but significant difference between the words data and information in the sentence above. Whereas data fundamentally can be defined to be a sequence of zeroes and ones, information essentially is the same but implies in addition a certain utility or value to the end user or recipient.
So, whether data are information depends on whether the data have utility to the recipient. Typically, for raw data to be information, the data first need to be processed, aggregated, summarized, and compared. In summary, data typically need to be analyzed, and insight, understanding, or knowledge should be added for data to become useful.
Applying basic operations on a dataset may already provide useful insight and support the end user or recipient in decision making. These basic operations mainly involve selection and aggregation. Both selection and aggregation may be performed in many ways, leading to a plentitude of indicators or statistics that can be distilled from raw data. Providing insight by customized reporting is exactly what the field of business intelligence (BI) is about.
Business intelligence is an umbrella term that includes the applications, infrastructure and tools, and best practices that enable access to — and analysis of — information to improve and optimize decisions and performance.
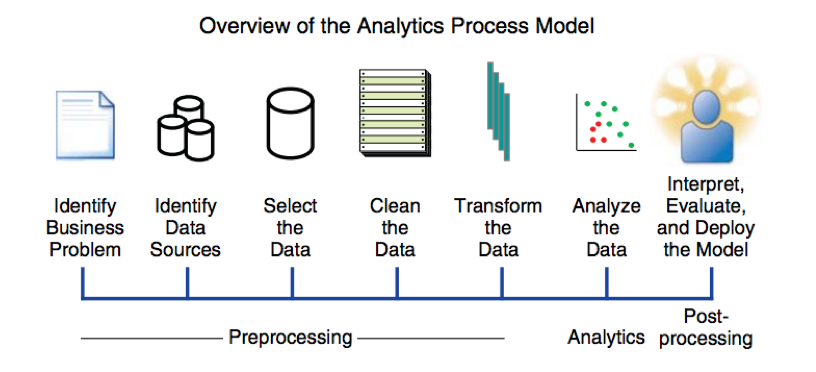
This model defines the subsequent steps in the development, implementation, and operation of analytics within an organization.
-
Step 1
As a first step, a thorough definition of the business problem to be addressed is needed. The objective of applying analytics needs to be unambiguously defined. Some examples are: customer segmentation of a mortgage portfolio, retention modeling for a postpaid Telco subscription, or fraud detection for credit cards. Defining the perimeter of the analytical modeling exercise requires a close collaboration between the data scientists and business experts. Both parties need to agree on a set of key concepts; these may include how we define a customer, transaction, churn, or fraud. Whereas this may seem self-evident, it appears to be a crucial success factor to make sure a common understanding of the goal and some key concepts is agreed on by all involved stakeholders.
Step 2
Next, all source data that could be of potential interest need to be identified. The golden rule here is: the more data, the better! The analytical model itself will later decide which data are relevant and which are not for the task at hand. All data will then be gathered and consolidated in a staging area which could be, for example, a data warehouse, data mart, or even a simple spreadsheet file. Some basic exploratory data analysis can then be considered using, for instance, OLAP facilities for multidimensional analysis (e.g., roll-up, drill down, slicing and dicing).
Step 3
After we move to the analytics step, an analytical model will be estimated on the preprocessed and transformed data. Depending on the business objective and the exact task at hand, a particular analytical technique will be selected and implemented by the data scientist.
Step 4
Finally, once the results are obtained, they will be interpreted and evaluated by the business experts. Results may be clusters, rules, patterns, or relations, among others, all of which will be called analytical models resulting from applying analytics. Trivial patterns (e.g., an association rule is found stating that spaghetti and spaghetti sauce are often purchased together) that may be detected by the analytical model is interesting as they help to validate the model. But of course, the key issue is to find the unknown yet interesting and actionable patterns (sometimes also referred to as knowledge diamonds) that can provide new insights into your data that can then be translated into new profit opportunities!
Step 5
Once the analytical model has been appropriately validated and approved, it can be put into production as an analytics application (e.g., decision support system, scoring engine). Important considerations here are how to represent the model output in a user-friendly way, how to integrate it with other applications (e.g., marketing campaign management tools, risk engines), and how to make sure the analytical model can be appropriately monitored and back-tested on an ongoing basis.
Book giveaway!
If you are as excited about business analytics as we are and want a copy of Bart Baesens’ book Profit Driven Business Analytics: A Practitioner’s Guide to Transforming Big Data into Added Value, enter to win a free copy in our book giveaway today! The first 5 commenters to correctly answer the question below get a free copy of Baesens book! Winners will be contacted via email.
Here's the question:
What Free SAS Press e-book did Bart Baesens write the foreword too?
We look forward to your answers!
Further resources
Want to prove your business analytics skills to the world? Check out our Statistical Business Analyst Using SAS 9 certification guide by Joni Shreve and Donna Dea Holland! This certification is designed for SAS professionals who use SAS/STAT software to conduct and interpret complex statistical data analysis.
For more information about the certification and certification prep guide, watch this video from co-author Joni Shreve on their SAS Certification Prep Guide: Statistical Business Analysis Using SAS 9.

14 Comments
Big data will be the next leading feature of the data analytics.
Thank you all so much for your correct answers! The free giveaway is now closed! Congratulations to all the winners!
Fraud Analytics with SAS®: Special Collection
Hi Nel! Thank you for your correct Answer! I will be in touch via email with your free copy!
Fraud Analytics with SAS®: Special Collection
Hi Jiaming Miao! Thank you for your correct answer! I will be in touch via email with your free copy!
Cool~
Fraud Analytics with SAS®: Special Collection
Hi Leo! Great work on this correct answer! I will be in touch via email with your free copy!
Fraud Analytics with SAS®: Special Collection
Hi Arie! Thank you for the correct answer! I will be in touch via email with your free copy!
Fraud Analytics with SAS®: Special Collection
Hi Ajit Kumar Sharma! Thank you for the correct answer! I will be in touch via email with your free copy!
I downloaded Bart Baesens's free e-book titled.
"Fraud Analytics with SAS®: Special Collection". Am I correct for your question?
Joe
Hi Joe! Thank you for the correct answer! I will be in touch via email with your free copy!