In SAS Visual Analytics 8.3, a Data View is a reusable and shareable template for a data source. That means that the data view is tied to the data source, and not to the report. If you update a data view it will not automatically propagate those changes into a report.
So, what can a data view do for you? Plenty! Here are just a few of the settings and customizations that a data view can save for a data source: (taken from documentation here):
- Data item settings such as names, formats, classifications, and aggregations
- Data source filters
- Hierarchies
- Derived data items
- Calculated items
- Custom categories
- Duplicate data items
- Show / hide status for data items
- Unique row identifier selection
Create a Data View
Now you must be wondering, how do you save all these wonderful customizations for your data source? Answer: by creating a Data View.
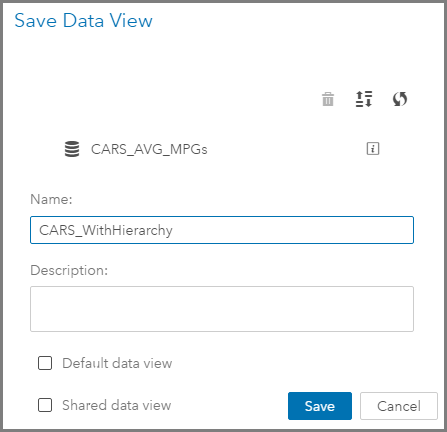
To get started, use the Data Source menu and select Save data view…. In this example, I created a hierarchy for the SASHELP CARS data set but as you can see from the list above you could have created many more calculations, custom categories, etc.

Then give the Data View a name. A few other things you may notice about this Save Data View dialogue are the options for: Default data view and Shared data view.
Default data view
A default data view is automatically applied whenever the data source is added to the report.
Each user can create their own data view of the source data and select their own default data view. This could lead to each user having a personalized default view. But, what if you want share your data views with others on your team? Or have everyone start with the same default view? That is when you need to first be an Application Administrator and second use the Shared data view option.
Shared data view
In order to be able to share a data view, you must be an Application Administrator. Then the option to share a data view will be available. Once a data view is shared for a data source, other users with access to that data source will be able to apply that data view.
Apply a Data View
Data views are templates of saved settings, hierarchies, custom categories, calculated data item, etc. which can be combined in an infinite amount of ways. Therefore, it follows that multiple data views can be applied to the same data source. In the example above, I created a new hierarchy for the SASHELP CARS data set. But I could also create a new data view which changes the aggregation of the MPG measures to reflect the average aggregation and not the default sum aggregation.
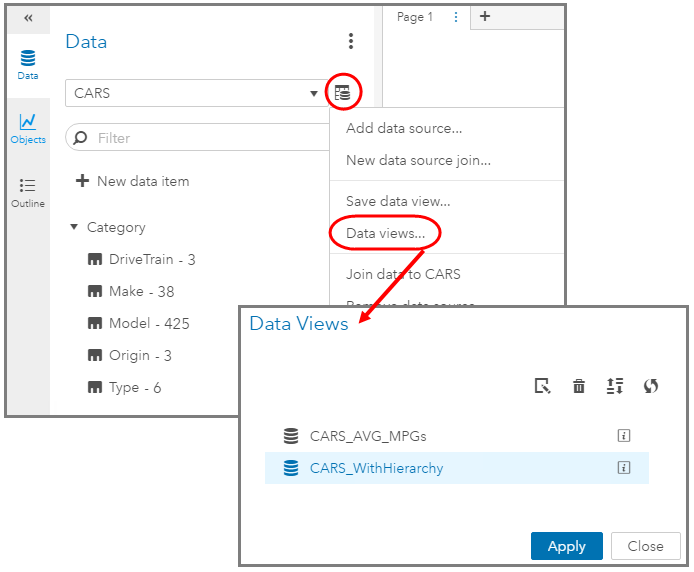
To apply a data view: open a new report, select your data source, then use the Data Source menu and select Data views…. You will see any individually created data views as well as any shared data views. Highlight the data view you wish to apply, then select Apply. Repeat for all of the data views you wish to apply.
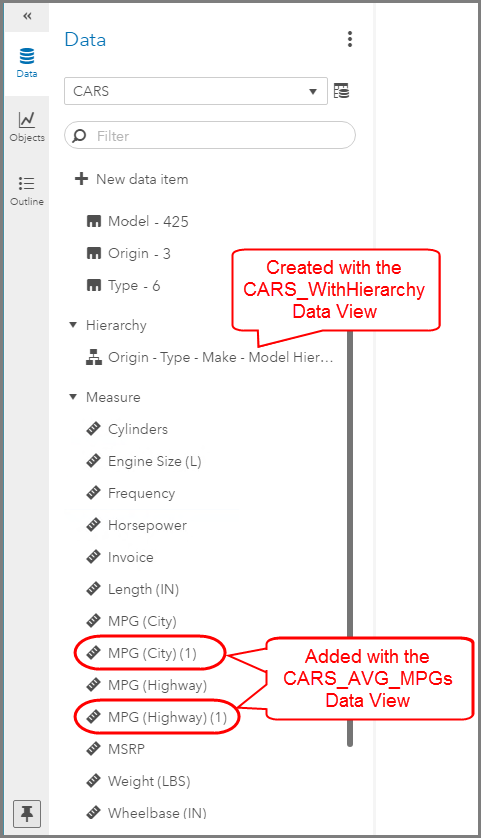
If any data items are duplicated with the addition of data views then, as shown below, those data items are given a (n) after their names.
Administrator-controlled Default Data View
We've learned what Data Views are and that we can share them. How can we ensure that all the users who select a data source get the same starting point with a particular data view? To set this up, you must be an Application Administrator and the Data View must be Shared.
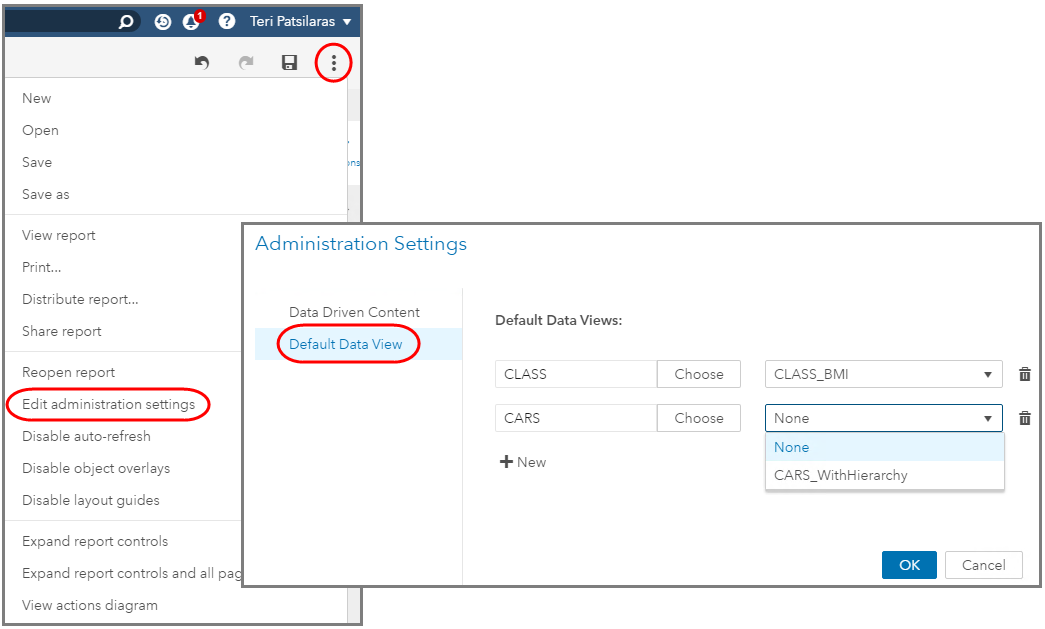
Once these two criteria are met, you can navigate to the report's overflow menu and select Edit administration settings. Then select the data source and which data view to apply as the default for all users.
Caution: If the user has already selected a personal default data view, then the personal default data view overrides the administrator-set default data view. Remember that an individual user can apply a personal or another shared data view and override the default data view.
Results of applying a default data view
Now let's take a look at the effects of an applied default data view. Whether this is a personal default data view or administrator set default data view, the resulting behavior is the same.
The default data view will be applied as the data source is added to the report, which eliminates the duplication of any data items that had any data item properties adjusted. As you saw above, when you apply a data view with the same data item name but different properties, it creates a duplicate of that data item. This behavior is different when a data view is set as the default. The default data view will apply those data item properties as the data source is added to the report and not "on top of" the existing data pane settings.
Let's look at a data view for the SASHELP CARS data source that has both the hierarchy definition and the changed aggregation for the MPG data items. As you can see I've saved it as both a Default data view, which makes it a personal default data view, and a Shared data view.

Here is what the data pane would look like. Notice that the hierarchy is there and that there are no duplicate data items for MPG(City) and MPG(Highway) but their aggregations reflect the change to "Average" that I applied in the data view.

Conclusion
Data Views are just one of the exciting new features in SAS Visual Analytics 8.3. A few key points to remember:
- Data Views are tied to a data source, not a report. If a data view is edited, those edits do not propagate to the reports that applied that Data View.
- A data source can have multiple Data Views applied.
- Only an Application Administrator can share a data view with other users as well as define a default data view for a data source for all users. Any personal defined default data views override the administrator-set default data view.
- A default data view, either personal or set up by an administrator, will not duplicate data items but simply apply the view's property changes in the data pane when the data source is added to the report.
- Data Views are a template of data settings and edits – not a fully robust semantic layer where updates are pushed to all instances of usage. While Data Views can be used to assist in defining commonly used calculations and custom categories, remember that each user can still create their own data views and thus override the administrator-set default.

9 Comments
perfect,it is clear for me as well how to use data views.
Hi Teri,
I'm using SAS VA 8.5 and I encountered a problem with the data view. Must the data view be saved as default if we want it to appear the next time we load the table?
Let's say I used source table A for the report, created a few calculated items, hierarchy, formatting etc. I saved a data view for all those transformations, called Data View 1. However, I did not save it as default. Then there was an error with table A that forced me to hit 'remove' and had to 'add data from source' again. After loading the new table A, when clicking on 'Data Views', I expected to see the Data View 1 that I had saved before, but there was none. I wonder if it was because I didn't set it as default? Or it just doesn't work that way? Is there any way I could restore my customized changes to a table?
Thank you in advance,
Mei
Hi Mei,
The Data View is saved with the data source. So as long as the table is not dropped and readded from CAS, then you should see the Data View available whenever you use that exact same data source.
If you want those changes to be automatically applied every time that data source is added to a report then that is when you should save it as a Default View.
I'll reach out to you offline in case you have additional questions.
Thank you,
Teri
Hi,
I am really struggling with these dataviews. On one hand, they seem like a very good idea... a great way to save all the calculations, hierarchies and formatting changes to be able to apply them to a fresh project (w/ the same dataset). However, the problem arises when a new project is started w/ an existing dataset and when the dataview is not specifically applied. In this case, even though the dataset is still somehow associated w/ this existing dataset (from previous project), because it has not been explicitly applied, the variables in the new project somehow take on a life of their own and no longer merge w/ the variables from the existing dataset when the dataview is eventually applied. Even for variables that are shared between the 2 projects and for variables to which nothing has been done in either project. Creates a very confusing mess. Would be much better if dataviews would at least try to merge same variables (even if we'd be given 1 at at time choices to choose from), instead of creating separate "(1)" versions. To try and do this manually (deleting and replacing variables w/ Dataview version) is time consuming and a real headache.
Hi Leslie,
You make a good point about the need to perhaps prompt the user if there are duplicate data items, present both options and ask to select one to keep or create a duplicate data item. I will pass this requirement on to our Product Managers.
I know you can run into the behavior you are seeing when you apply a Data View after the data source is selected for a report. You could, to avoid this behavior, make the Data View a “default” Data View for that data source – then you won’t have to apply it after you’ve added it to the report. (And you won’t get the mess.)
Any user can select their own personal Default Data View for a data source. From the Data Pane, use the data source menu and select Data Views. Then highlight the name of the Data View you want and click on the edit icon (the paper and pencil). Then select the check box to make it a Default data view. For the Default Data View to take effect – start a new report, select your data source, and now the Default Data View should be applied. Now going forward, for any new report and any time you pick that data source – the Default Data View will be applied. You can then make further data item changes and save that data view as a new name and make it the default view for that data source going forward.
If you are an Application Administrator then you can use the report menu and select the Edit administration settings. From there you select the data source and then pick a default Data View for that data source. This means that any user that selects that data source will start with the application administrator’s assigned data view. If you have a personal Default Data View applied – then the personal Data View wins.
Let me know if either of these tips need further clarification and I can connect with you offline.
Thank you,
Teri
Hi Teri,
This is really a great feature of SAS Viya.
I am also looking for the star schema modeling on SAS Viya as we were able to make a lasr star schema in SAS VA 7.4, but could not find any option on SAS Viya
If you can help.
Thanks,
Mehul.
Hi Mehul,
Star schema views will be coming to Viya soon but for now you are able to join tables in a VA report starting in Viya 3.4/VA 8.3: VA 8.3 Join Tables in VA Reports
Thank you,
Teri
Teri, This is a great method, but I am wondering if there's a way (in 8.3) to simply change the URL (with a parameter on the URL itself) in order to display the report with differing results.
Eg.
https://itviya.sas.com/links/resources/report?uri=/reports/reports/be8d3bce-b790-4621-93af-d9f54d8c35b9&page=vi6&PLocation=CANADA
or
https://itviya.sas.com/links/resources/report?uri=/reports/reports/be8d3bce-b790-4621-93af-d9f54d8c35b9&page=vi6&PLocation=NORWAY
etc.
Do you have any blog articles on this? Thanks in advance, Chris
Hi Chris,
I do have a blog that outlines the steps for SAS VA 7.2: Accessing VA Reports with Parameterized URLs
The difference for VA 8.3 is that you cannot use the Email feature to grab the Report Name and Report Path since it uses the URI. The easiest place to grab these values are from Environment Manager under the Content tab. Once there, browse to your report, then you can easily identify the Report Name and Report Path to use in your URL.
Use my VA 7.2 blog to help walk through the steps of creating the corresponding parameters to store the control object values and then most everything else is the same.
Thank you,
Teri