➤ DISCLOSURE!
 I have to admit: I am biased. Out of all geometrical shapes, I favor circles the most. I am attracted to them because they are perfect geometrical figures. They are well rounded, all-around symmetrical and their shape and size are defined by just one parameter – their radius. Plus, to my taste they are just gorgeous and sweet (I am talking π here).
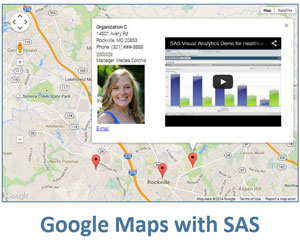
Handpicked Related Content: The power of SAS-generated InfoWindows in Google maps
Geometrical fact: circles belong to a plane as opposed to spheres that exist in a 3D space, like our Earth. Notably, Google map transforms Earth (a sphere) to a plane. In other words, a Google map represents a portion of the Earth’s surface flattened to a plane.
If circles belong to a plane and Google Map is a plane, one can easily conclude that circles belong to Google map. Well—this logic bending would most definitely tick off Sheldon Cooper of The Big Bang Theory, but don’t we often arrive to desirable conclusions regardless of logic! Besides, I admitted that I love circles, and I love Google maps - do not expect me to be rational here - passion is a valuable substitution.
How circles are useful in business
Let’s see when circles on Google maps can be useful. While the basis for their usability lies within geometry and physics, real life provides a variety of examples. Here are just a few that come to mind.
- Shopping for goods and services. This is a staple of our everyday lives. We look for stores, restaurants, doctors, schools, pizza places – all within a certain distance of our place. That is we are looking at a circle on map.
- Cellphone coverage area. Each cellphone tower covers a certain range, which is a circle. A network of such towers covers the map by circles. Similar coverage ranges are true for TV cable or fiber-optic networks.
- Catastrophic events. Earthquakes or explosions happen in a single location (epicenter) with effects spreading around in circles.
- Crime. When a specific crime is committed in a certain place of a city, the law enforcement always look at a circle area identifying registered offenders living within its boundaries as possible suspects. Another scenario: recently there was a bank robbery in our area. The minute the robbers left the scene in their car, bank clerk called the police with the information on the car and robbers. Police reaction – they stopped all traffic within a radius R form the bank; it took them less than 30 minutes to sort through the cars and pick up the perpetrators (and cash).
I am sure there is a lot more! Please use the Comment section below to provide your business scenario.
How to overlay circles on a Google map
While circles on a Google map can be drawn as an approximation by a polygon presented in my earlier post, luckily Google realized the uniqueness and significance of circle, and made it much easier to draw it based on just two parameters: center location and radius. The Google Maps API provides for more than these two parameters, allowing you to specify styles such as color of the circle’s circumference, circle fill color, color opacity and other properties of the circle drawn on the Google Map.
You can draw multiple circles on the map similar to drawing multiple markers on a Google map when circle center positions and radiuses are read from a source data table. Or you can draw circles interactively by just clicking on the Google Map. In the latter case, you just place the circle drawing function in the click-event listener rather than in the unconditionally run part of your code.
Click here to download the SAS code for how to draw interactive circles on the Google map.
When generating circle overlays on the Google map, I defined the following properties in the code:
- stroke determines the circumference style
- fill determines the circle fill style
- radius determines the circle radius in meters
You can easily convert radius in miles into radius in meters and vice versa using these formulae:
R(m) = R(mi)*1609.344;
R(mi) = R(m) * 0.0006213712.
These additional parameters make real difference for users:
- draggable: true
- editable: true
The default for these optional parameters is false. However, when set to true, they make circles draggable over the map (just press mouse button over the circle and move it around, then drop by releasing the button), and editable (you can hover mouse over the little white circular handles on your circle and increase or reduce the circle’s radius by dragging the handle inwards or outwards). You can use either of these, both or none.
Exploring circles on Google maps
Please note that these circles are not in a separate layer independent of the map: they are “glued to the map” and are part of it. You can zoom in or out the map and the circle will scale accordingly, or you can move your map and the circles will move with it.
You can create as many circles on the map as you want – just keep clicking on the areas outside the circles. You can shuffle them around and resize.
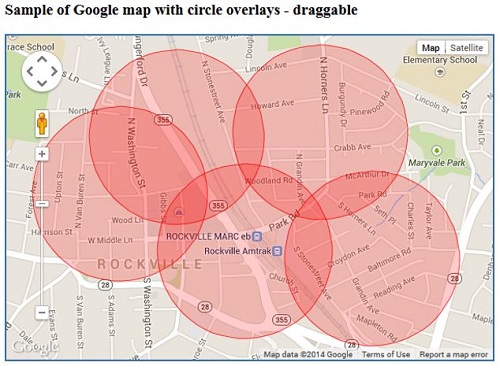
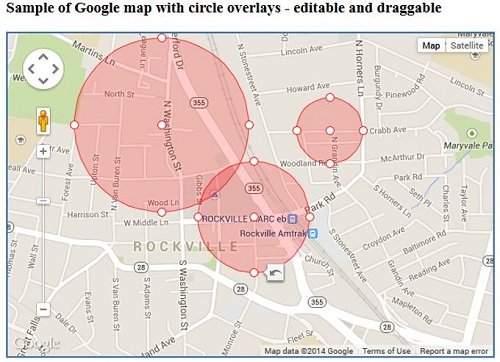
Click on the Google maps images below to experience interactive versions.
In the following example, the circles are draggable. Click anywhere on the map to create a circle. You may continue clicking outside the circles to create more circles. You can reposition (drag) the circles with your mouse by clicking+holding+moving.
In the following example, the circles are draggable and editable. That is in addition to being able to move the circles around, you can modify their sizes with your mouse by dragging little circular handles inwards or outwards.
As you can see, circles play very special role in Google maps. In addition, besides being a natural visualization of a map area of certain size and shape, circles can be used in a similar manner as in bubble plots, where circle sizes (radius or area) represent completely different (not geometrical) parameter of a place on the map. For example, circle size can represent a city population, school or hospital capacity, or a company capitalization, or about anything else. Furthermore, the circle colors can represent and visualize even something else.
I would love to see your comments on your business use of circles in Google maps, as well as your desired functionality.
Handpicked Related Content: The power of SAS-generated InfoWindows in Google maps

9 Comments
Washington DC
Close.
North Korea city
It could be any city for that matter.
Really nice!
Very cool stuff.
Just make me think if it's possible to draw multiple circles and multiple markers at same time so that I can drag the circle around markers. Also how to erase the circle on the map after you create it?
Thank you for sharing.
Ethan
Ethan, thank you for your feedback. Of course, you can combine this circles-drawing functionality with multiple markers.
To delete a circle you will need to call the setMap method on the Circle object with null as an argument:
mycircle.setMap(null);
You can probably implement this using double click (dblclick) as an event for the circle deletion. That is you will create a circle by clicking on Google map, and you will delete the circle by double clicking on the circle. See this Google Maps API Events Handling.
First: Thanks, great series! I have not yet played with it myself, but this is definitely filed in my brain for future exploration should I start on a new project that needs maps. Neat stuff.
Wondering if it would be possible to use a circle like a URL drill down annotation. That is, in a stored process setting, have a stored process which returns this map with circles on it. And when a user clicks a circle, have that launch a stored process drill down which then gives a detailed report for that region (or whatever). Like you would do drill downs for SG charts.
Sound feasible?
Thank you, Quentin, for your feedback. I will try to address drill-down functionality in one of my future posts.