➤ DISCLOSURE!
 In my prior post, Spice up SAS output with live Google maps, I discussed the idea of delivering live Google map through SAS output and demonstrated the feasibility of doing so in SAS Information Delivery portal. Similarly, it can be done for any SAS HTML output. You would just need to replace file _webout for SAS portal with any file reference pointing to an HTML file.
Handpicked Related Content: The power of SAS-generated InfoWindows in Google maps
Since the first post was well received by the SAS community and generated numerous questions, I have decided to expand on it and show some additional functionality that can be incorporated into SAS output in regards to the Google maps.
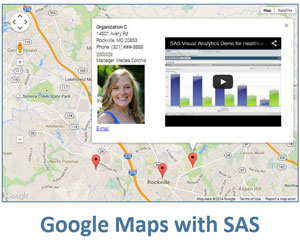
In this post, I will demonstrate how to use SAS to generate Google map with multiple points (or markers, using Google terminology) and incorporate it into SAS HTML output.
Using SAS data sets as input
In the first post I used SAS macro variables to pass the data into SAS-generated Javascript that embeds Google map into SAS output. It was adequate for proving the concept; however, here I will use SAS dataset as a natural source of the data.
Let’s assume that we have the following data table with three observations, each corresponding to a single point on the Google map:
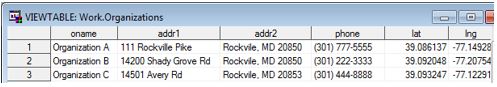
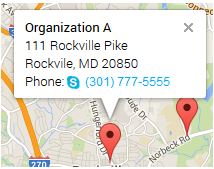
Although for showing three points on map as markers, we only need the latitude and longitude (lat and lng variables in our table), the remaining variables will be used to display an information window when user clicks on a marker, as shown in Figure 2:
Writing the code
Displaying multiple live Google map markers in your SAS output can be accomplished in six fairly easy steps. You can view and download the full sample SAS code. Here are explanations and clarifications for each section in this example:
1. Specify the HTML output file location. Use the FILENAME statement to assign a fileref to the physical location of the HTML file you are going to generate.
2. Prepare the data. To make this example more self-contained, I generate the SAS table in Figure 1 within the code itself. In reality, you would prepare your data table by pulling or combining data from a database or other data storage.
3. Determine the map center. For a single marker implementation, a trivial solution would be to assign map center to the same location as the marker. When there are multiple markers, some map center considerations have to be made. In the latter case, you would want Google map center to be somewhere between the multiple markers. A geometrical way of handling this problem is to let the midpoint of the latitude and longitude range determine the center coordinates. Here is the formula to calculate the center coordinates:
C(lat, lng) = {min(lat) + [max(lat)-min(lat)]/2, min(lng) + [max(lng)-min(lng)]/2}In this implementation, I chose a less geometrical, but a simpler and viable approach using averages and used the MEANS procedure in the sample code to implement it:
C(lat, lng) = ( avg(lat), avg(lng) )
4. Initialize the map. This code portion uses a DATA _NULL_ step to generate a non-repeatable section of the code, and it mostly coincides with the code from a previous post with an exception. In this example, I use the map center coordinate variables that were calculated in the previous step instead of macro variables. To simplify, I also use a constant zoom level (zoom: 12) to control the Google map scale. Obviously, if needed, you can determine the scale dynamically based on your data.
5. Add multiple markers. This portion of the code also uses a DATA _NULL_ step, but here the DATA step loops through the source data as many times as there are observations in the source data, thus generating as many markers. Here are other notes about this section:
- To append to the output HTML files, I use the mod option:
file fout mod;
- I use inline styling to modify the default width of the Google map information window. Similarly, you may apply other CSS styles here or in an external CSS using class= or id= selectors.
'var info' i "= '" '<div style="' 'width:150px;"><b>' oname "</b><br>" addr1 "<br>" addr2 "<br>Phone: " phone "</div>" "';"
- I use the following statement to generate the Javascript variable suffix corresponding to each observation in the source SAS data set:
i = strip(_n_);
6. Wrap up the HTML file. Again, I use a single-iteration DATA _NULL_ step to wrap up the Javascript and HTML. The bottom portion of the code contains information about the styling of the final embedded Google map:
data _null_;
  file fout mod;
  put
  '}'
  'google.maps.event.addDomListener(window, "load", initialize);' /
  '</script>' /
  '</head><body>' /
  '<h3>Sample of Google map in SAS output with multiple points/markers</h3>' /
  '<div id="map-canvas" style="width:550px; height:350px; border: 2px solid #3872ac;"></div>' /
  '</body></html>'
  ;
run;
Using the final map
Running the above code sample produces the gmapoutput_mm.html file which, when opened in a web browser, produces the following Google map containing all three points of interest represented by markers shown in Figure 3.
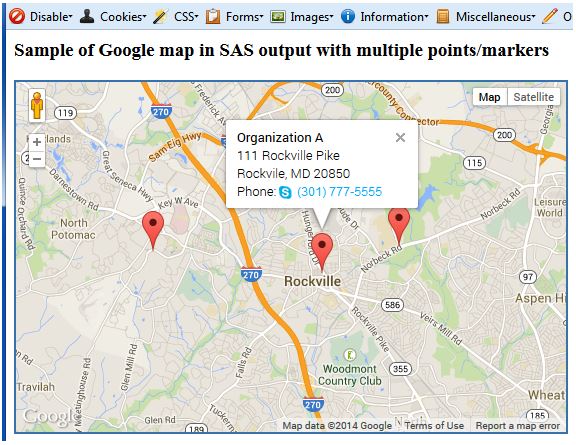
Click for an interactive version of the map.
This map is interactive: you can move it around, zoom in and zoom out, and you can click on markers to display detail information about that location in a popped information window.
The code that produced this map is completely data-driven in the sense that all the information comes from a data table. I'm hoping that, by now, you can see how relatively easy it is to incorporate Google maps into SAS-generated output and that you will start using this technique for your benefit.
Handpicked Related Content: The power of SAS-generated InfoWindows in Google maps

25 Comments
Hi Leonid,
In your step 5. Add Multiple Markers, can you label the marker with a letter and color the marker where the letter and the color are read from the data source?
Thanks,
Michael Cuenco
Hi Michael,
I am not aware of the feasibility to place "text" on the markers. However, you can create a set of different markers with different letters and different colors, and then you can have your data drive the logic of which image to display for a particular marker. You can find an example of this implementation in my blog post SAS to the rescue: claiming your location on Google map...
Please let me know if this answers your question.
Best regards,
Leonid
Hi Leonid,
I tried to implement your code and generate the map with location but failed to show the location. When I run the html file I can just see the map but not the location. Any thoughts?
Sandesh,
That is because in your generated code you are referencing custom marker images, but you do not supply those images. You should either have those image files in the specified location, or use default markers.
Is it doing well when I use SAS fraud framework?
Is it possible to integrate fraud framework with google maps api?
Sun,
As far as I know, SAS Fraud Framework is built around SAS Information Delivery Portal. You can integrate Google map with SAS Information Delivery Portal. Read more about creating Google map as a stored process and embedding it in SAS ID Portal in my prior blog post http://blogs.sas.com/content/sgf/2014/06/06/spice-up-sas-output-with-live-google-maps/.
Pingback: Circling Google maps with SAS - SAS Users
Thank you for this code and the idea. I dabbled a bit with it and made a pretty useful tool (IMO). The tool is not a production tool, just a concept of what's possible with SAS code and Platform Scheduler. This is what it does, I use SAS code to find customers that meet a certain criteria, I group them by a common attribute (node), then plot the attribute on the map using a red circle with an "X". Another map shows the customers by their lat\long coordinates.
Now all I need to do is link the 2 maps. I want to be able to click on the red x (which shows how many customers met that criteria on that node) and have the customer detail map open up zoomed in to show the customers off of the clicked node.
Again, thank you for the code and the idea!
Pingback: The power of SAS-generated InfoWindows in Google maps - SAS Users
Pingback: Drawing overlays on SAS-generated Google maps - SAS Users
One more thing. I have been using the andriod app, Latitude & Longitude on my Samsung Galaxy Note 3 and can get up to 7 digits after the decimal point and an accuracy of about 11m. Is that what people use to get the lat/long values or is there a better way to do this?
Tom, thank you for sharing your way of getting those.
In my prior post http://blogs.sas.com/content/sgf/2014/06/06/spice-up-sas-output-with-live-google-maps/, I used another way of finding the latitude/longitude coordinates: "What's here?" Google map functionality, that provides 6 digits after decimal points.
I am sure there are numerous ways, apps and data bases to get those coordinates and I would love to hear from our blog readers how and where they get their geo data.
I had another idea of using google maps to identify the location of areas in the subdivision that need work. Two things came to mind. The first was to identify the location of dead trees that need to have their stumps grinded down. The other was to identify the location of the 17 sprinkler controllers throughout the subdivision. I guess the list can go on and on but that is why I was using my phone to get the coordinates.
Now just waiting for the book "SAS and Google Maps with examples made easy" by Leonid Batkhan...:>)
Tom, thanks for the idea 🙂 Meanwhile, you can take a look at another post - on creating clickable areas on Google maps - Drawing overlays on SAS-generated Google maps, see it at http://blogs.sas.com/content/sgf/2014/08/29/drawing-overlays-on-sas-generated-google-maps/
Leonid, great and useful stuff! I was curious if the infowindow could be set up to display an image?
For example, lets say I have sites of office locations and when I click on the icon instead of showing text only, can I display the office manager?
Another example is on a much smaller scale but same principle. Our home owners association has 220 homes and 8 members of the board. It would be nice to display the location of the board members along with their picture and some info about them such as name, title, address, email address and phone number.
I have looked at how this can be done and hoped to translate it into SAS code but could not find anything after a fairly extensive amount of time. Any chance you could create an example similar to this? I think it would make for a great SAS / google maps blog post...
Tom, thank you for your feedback and questions.
The short answer is yes, info window can display text and images. In fact, in info window you can use any HTML syntax. For displaying an image, you would need to construct your var info as in the following example:
var info = '<div><img src="image1.jpg"><b>Organization A</b><br>111 Rockville Pike, Suite 1000,<br>Rockville, MD 20850<br> Phone: (301) 838-7030</div>';
Those image file names can be part of your source data.
I will try to compile a more comprehensive code example and present it in one of my future posts.
Very much looking forward to it!
I love the program but i like to use image names. but script is for one record.
var info = 'Organization A111 Rockville Pike, Suite 1000,Rockville, MD 20850 Phone: (301) 838-7030';
I have in my source dataset the link to the image.
Do you have maybe the javascript for var info included the image
'var info' i "= '" '' oname "" addr1 "" addr2 "Phone: " phone "" "';" /
Hans, if you want to use custom markers, you need to add
iconoption to the marker definition, e.g.'var marker' i '= new google.maps.Marker({' /'position: point' i ',' /'map: map,' /'icon: ' brand ',' /'title: "Click here for details"' /'});' /where variable
brandholds URLs to your marker images. Does this work for you?This is very helpful. I especially like the flexibility of the data preparation step. Thanks for expanding your original post.
I've just started working with Javascript so maybe you can answer a question. Is there a way to turn all of the information windows on and off with a single click?
Thank you for your comment!
Yes, you can turn on all the information windows with one click, but I would not recommend doing that as the information windows may overlap thus cluttering the view.
With dozens of markers in my application that I want to compare at the same time, it's a necessary trade-off. Can you point me to where I can find the code to do this?
Gary, you can look up more information on Google map information windows here: https://developers.google.com/maps/documentation/javascript/infowindows. However, here is an excerpt from that link:
Best practices: For the best user experience, only one info window should be open on the map at any one time. Multiple info windows make the map appear cluttered. If you only need one info window at a time, you can create just one InfoWindow object and open it at different locations or markers upon map events, such as user clicks. If you do need more than one info window, you can display multiple InfoWindow objects at the same time.
I believe that in your situation with "dozens of markers", if you open all information windows at once, they will overlap so you won't be able to read all of them.
An alternative solution may be to display information on multiple locations in a single information window that is opened by clicking on either location.
Much thanks for the help and advice.
You are very welcome!