➤ DISCLOSURE!
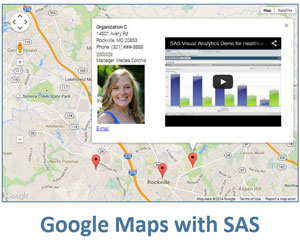 Google maps are one of the most versatile and widely accepted features of the modern Web, and they can spice up and bring more interaction to SAS’ intrinsic menu of visuals (dashboards, graphs, OLAP cubes etc.) that are usually served at the SAS Information Delivery Café (Portal).
I wanted something simple, more dynamic and flexible in structure and better blending with the rest of the delivered contents. SAS stored process naturally came to mind.
Handpicked Related Content: The power of SAS-generated InfoWindows in Google maps
Before I dove into the task of incorporating live Google map into HTML output delivered via SAS Information Delivery Portal, I asked around colleagues and contacts about my chances of success and their estimates were somewhere on the scale from a definite impossible, to maybe, to 50/50 chance. It was just uncharted territory.
I did some digging, and it turned out that the struggle was not that difficult, and the result was sweet success. It turned out to be quite easy to embed live Google map into SAS output generated by a stored process, and that added a completely new dimension to the level of interaction within a SAS portal. The portal users just loved it!
Let me show you how simply and effectively to embed a live Google map into SAS-generated HTML output and deliver it to users within a SAS Information Delivery Portal.
About the Google Maps API
Google uses the Javascript Application Programming Interface (API) for its Google Map functionality. The current release of the Javascript API v3 Reference can be found in the Google Maps Javascript API V3 Reference.
For publicly accessible web sites, Google grants free license for their Google map API; however, non-publicly accessible sites must purchase business license from Google. Refer to Google Maps/Google Earth APIs Terms of Service and Client-side APIs for more information.
However, Google allows for limited use of Google Maps without the purchase of a license. Moreover, with API v3, it is not necessary to use an API key from Google, which was required prior to v3.
The legal requirements imposed by Google potentially can change with time. This example focuses on technical feasibility and programming technique in integrating Google maps with SAS Business Intelligence applications, in particular with the SAS Information Delivery Portal.
Where to start
![]() Let’s create a simple Google map for a particular location with an Information Window and a marker in that location, which is that bubble shape showing some information about that location (e.g. name, address and phone number). Let us also make the Information Window appear and disappear at the click of a mouse.
Let’s create a simple Google map for a particular location with an Information Window and a marker in that location, which is that bubble shape showing some information about that location (e.g. name, address and phone number). Let us also make the Information Window appear and disappear at the click of a mouse.
To display a Google map, you must define latitude and longitude coordinates of the middle point of the map. For simplicity, this example places the marker in the middle of the map.
Determine latitude and longitude coordinates
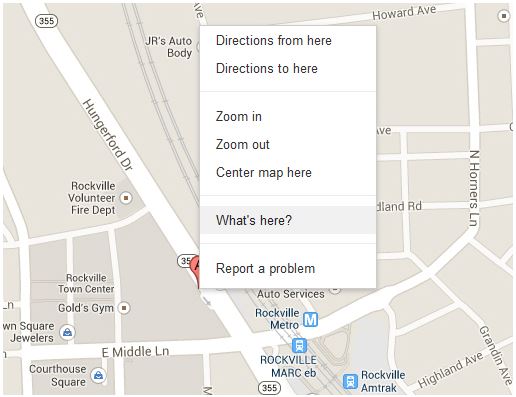
While in a Google Map application in a browser, right-click on the location of interest and select What’s here? from the pop-up menu:
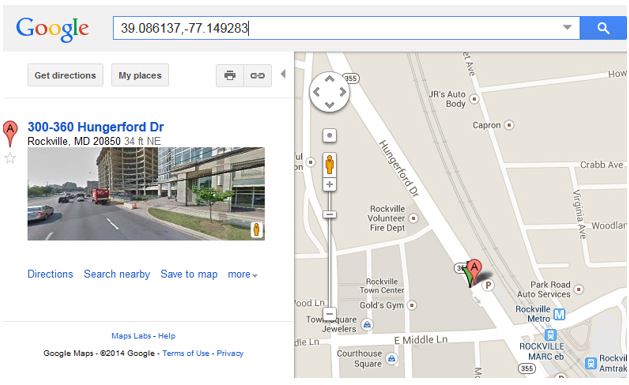
Once you do that, latitude and longitude coordinates are displayed in the Google search definition field as shown in the top of the following figure:
Write the SAS code
You will need the latitude and longitude coordinates of a marker as well as any other information you would like to display in the Google map Information Window.
All this information can be either hard-coded into your stored process or can come dynamically from a data table or database. In the latter case, the stored process should include one or several prompts that will unambiguously define a single record in the data. For dynamic processing, you will need to subset your data by applying prompt values as filters in a WHERE or IF clause in the SAS code. Of course, you may display multiple markers by pulling several records, but for simplicity and illustration purposes, the code below only shows a single marker which is positioned in the center of the Google map.
This example uses SAS macro variables to assign values to the parameters passed to the SAS code. Besides assigning the macro variables (or, alternately, dynamically deriving them from a database), the SAS code for creating the Google map uses a single null SAS DATA step with one PUT statement to generate HTML and Javascript that display the Google map in a web browser.
Download the full sample SAS code here.
Display the map
You can control initial map zoom with the ZOOM parameter, which in this example is set to 15. You can also control the map type (ROADMAP, SATELLITE, HYBRID or TERRAIN for certain locations). For example, MapTypeId.ROADMAP displays the road map view. This is the default map type.
You can also make those parameters dynamic, depending on location type and other variables. In this case, you would need to replace the hard-coded (static) values with SAS macro variable references (as has been done for &latitude and &longitude) and assign those macro variables dynamically (e.g. CALL SYMPUT) in your SAS code.
Please note that the map position on the page is defined in the body of HTML, in our example, it is in the bottom of the code along with styling information:
<div id="map-canvas" style="width:500px; height:350px; border: 2px solid #3872ac;"></div>
Register the stored process and add it to the portal
After you finish the SAS code, you need to make the program a stored process by registering it with the SAS Metadata Server and then add it to the SAS Information Delivery Portal.
- To register a stored process in the SAS Management Console, select the Folders tab and navigate to the folder where you would like to save your stored process registration.
- Right-click on that folder and select New &rarrow; Stored Process…
- Proceed with the registration, defining prompts as needed. Make sure you check Stream for the Result Capabilities property.
- In the SAS Information Delivery Portal, add the stored process to the appropriate Collection portlet.
Now, when you click on that link, the stored process will run and display a view of the live Google map.
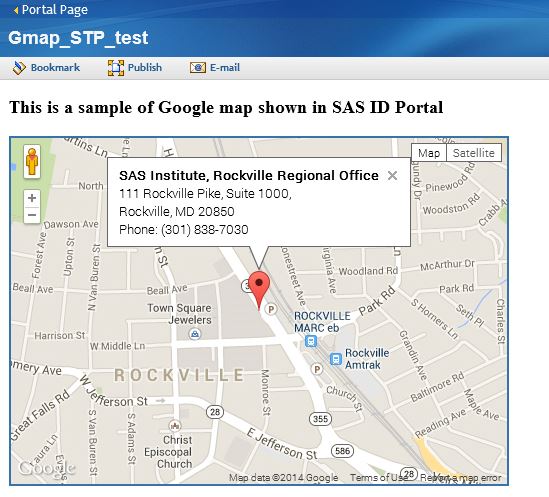
Click for an interactive version of the map.
Conclusion
Google maps can be embedded into any SAS-generated HTML output. This example illustrates the feasibility of embedding Google maps into a SAS stored process and delivering it via a SAS Information Delivery Portal.
Note: Do not expect this stored process to work in SAS Web Report Studio, as it generates XML-based output, not HTML.
Handpicked Related Content: The power of SAS-generated InfoWindows in Google maps

18 Comments
Very nice. I only have SAS Studio, but fortunately, you can run this even without SAS Information Delivery Portal, and just view the webpage on your own. It seems that Google has changed their rules for maps since they put watermarks all over the image.
I have enjoyed this and many of the other Google maps blogs. Very cool use. One downside is I can tell to be really good at this I would have to brush up my javascript and html skills. Always something more to learn.
Yes, you can run this in any SAS BASE environment (SAS is used here to dynamically generate HTML/Javascript webpage). And yes, Google did change their rules for Google maps. in June 2018 Google introduced changes to the way it handles its Maps platform. They now require API key in order to embed a map, plus Google Maps “projects” must now be associated with a billing account (you must provide a credit card). The pricing depends on the traffic volume. You might not incur actual charges as Google also provides a complimentary $200 monthly credit for each Maps project. But there is no way I am giving them my credit card as that traffic count is outside of my control 🙂
We are constantly looking to enhance our user experience, and this just has the right amount of sparkle! Thank you for sharing!
Thank you, Cristina.
You may follow up the entire Google map series at http://blogs.sas.com/content/sgf/tag/google-maps/ for more sparkles if you ever need it.
This is wonderful tool I can use at work. Wondering if those markers can be classified into different colors and shapes or sizes. Also after running your code, I added more information into other than just address,phone. The result of html file is not able to display without any error messages in saslog. Do you have any idea what I am missing?
Thank you.
Ethan
Ethan, thank you for your feedback and questions.
1. The answer to your question about different marker shapes, sizes and colors is YES, you can customize marker's icon in a variety different ways, see this Google's developer documentation:
https://developers.google.com/maps/documentation/javascript/markers#icons
2. Your html problem might be related to your logical record length default is not enough to accommodate longer output string. This can be fixed by adding the following statement at the beginning of your code:
options lrecl=20000;
The maximum value for lrecl is 32767. Or you may just say:
options lrecl=max;
Thank you. It works like charm!
Pingback: Drawing overlays on SAS-generated Google maps - SAS Users
Pingback: Generate live Google maps in SAS - multiple markers
This is a very useful application for my work in higher education, but I would like to plot more than one point on a map. Unfortunately I have no experience with the Google Maps API. Will you be expanding the example to handle multiple points?
Gary, thank you for your interest and input. Per your request, in my next post I will expand the example to handle multiple points.
Thanks. Looking forward to it.
As promised, here is the blog post addressing multiple markers in SAS-generated Google maps - Live Google maps in SAS -- multiple markers, see it at http://blogs.sas.com/content/sgf/2014/07/24/live-google-maps-in-sas-multiple-markers/
Here is another post on creating clickable areas on Google maps - Drawing overlays on SAS-generated Google maps, see it at http://blogs.sas.com/content/sgf/2014/08/29/drawing-overlays-on-sas-generated-google-maps/
I think easy-to-use online maps such as Google Maps (and also GPS maps) have really helped raise people's awareness of how useful it can be to visualize their data on a map. It's exciting that what Leonid shows in this blog will allow you to combine the analytics of SAS with an easy-to-use Google map. It will be interesting to see what possibilities this opens!
Thank you, Robert. I am planning to follow up with other Google maps functionality delivered in SAS.
For those customers that have the need to produce static Google map images in their SAS output, I detail this process in my SAS Global Forum 2013 paper, "The Ins and Outs of Web-Based Data with SAS". The specifics of this process start in the HTTP section on page 11.
Thanks, Bill!