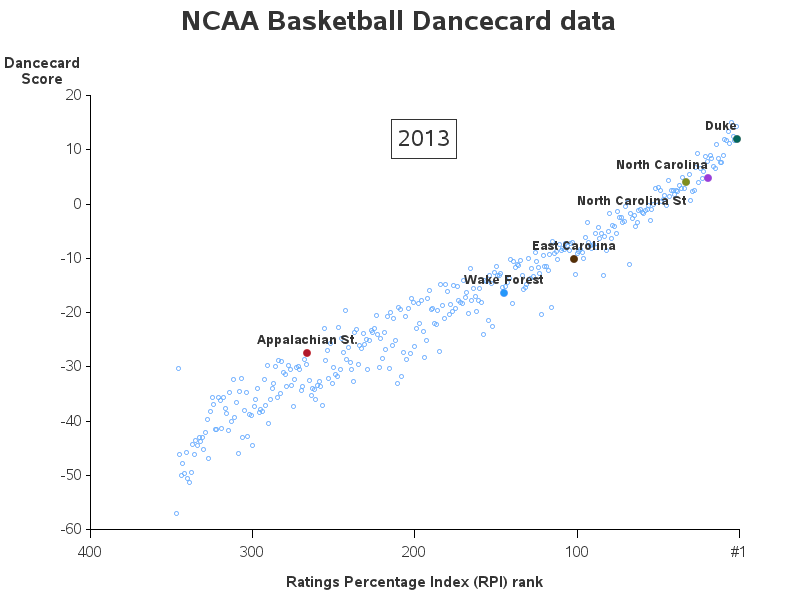
A big part of "winning" these days (be it sports or a business) is performing analytics better than your competition. This is demonstrated in awe-inspiring fashion in the book (and movie) "Moneyball." And on that topic, I'd like to show you a few ways SAS can be used to analyze sports data
Tag: sas/graph
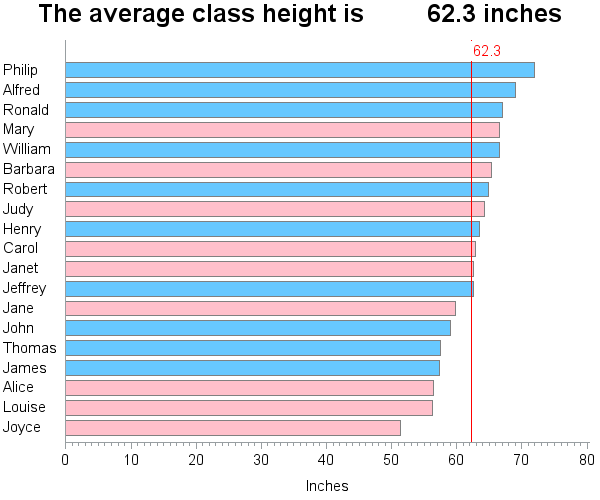
SAS macro variables are a great way to store a calculated value, so you can use it later in your code. They are not just limited to the data step -- you can also use macro variables in title statements, axis statements, etc. By default, the macro variable will be padded with
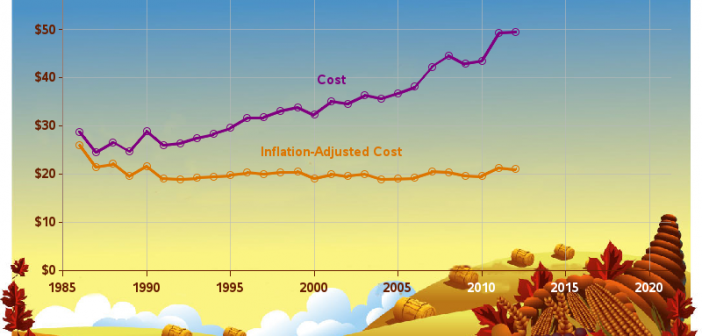
Have you heard the expression "Talk Turkey"? Well then, what better (tongue-in-cheek) thing to do around the Thanksgiving holiday, than talk some turkey using SAS Graphs! ;) I don't usually decorate my graphs with images and pictures (they typically make the graph more difficult to read), but when it comes
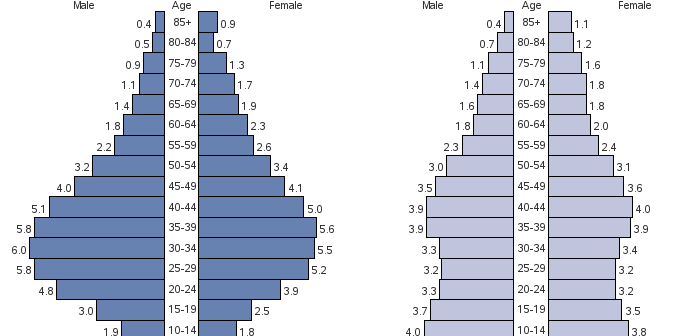
SAS/GRAPH gives you the ability to customize your graphs (or even create totally new types of custom graphs) ... and it is my firm belief that it gives you a competitive advantage by allowing you to "make sense" of your data in ways your competitors can't. Most of the examples in
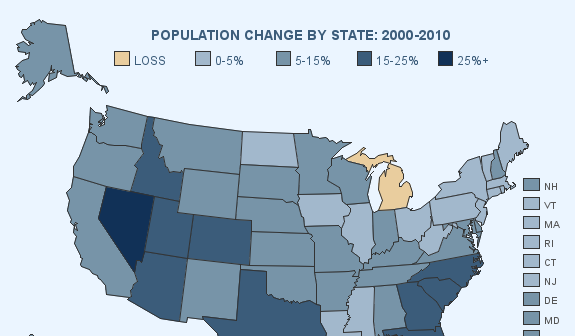
By now, most of you probably already know how to add drill downs and hover text to your SAS graphs. But did you know you can add pop-up images and graphs? Here are a couple of examples ... In this first example, when you hover your mouse over each state, you
Do you use SAS for analytics and Microsoft Excel for graphs? Why not use SAS for your graphs too?!? Then you could completely automate the entire process in one SAS program, with no manual steps! A lot of people use Excel to create their graphs because "it's what they know." What if somebody
Robert Allison's SAS/GRAPH: Beyond the Basics collects examples that demonstrate a variety of techniques you can use to create custom graphs using SAS/GRAPH software. To celebrate the book’s publication, we asked Robert to tell us more about why he loves SAS/GRAPH. Here’s what he had to say: A graph is