SAS Learning Post
Technical tips and tricks from SAS instructors, authors and other SAS experts.
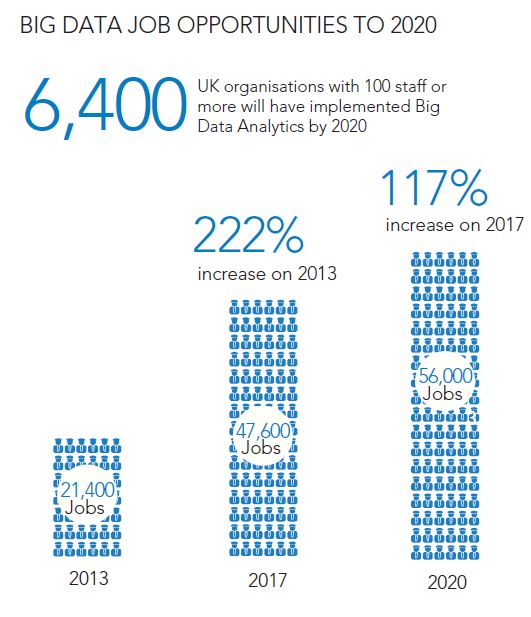
We now live in the era of ‘big data’, where data and its analysis have become crucial to the modern economy. In fact, "big data is the new 'corporate gold'," according to Mark Wilkinson, managing director of SAS UK & Ireland. A recent study by Cebr found that companies in

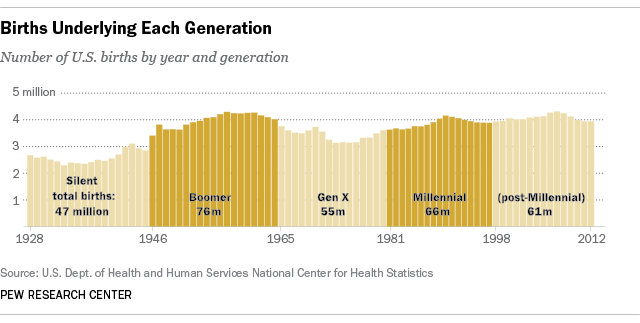
To get into the mood for this blog post, you should first listen to the music video of The Who singing My Generation... I guess everybody has 'their generation' and here in the U.S. the most famous generation has been the Baby Boomers. Many companies have tried to design products they

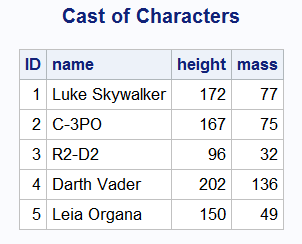
While perusing the SAS 9.4 DS2 documentation, I ran across the section on the HTTP package. This intrigued me because, as DS2 has no text file handling statements I assumed all hope of leveraging Internet-based APIs was lost. But even a Jedi is wrong now and then! And what better

Outside, the Cary, NC sky is gray and winds are blowing freezing rain, but a group of statisticians at SAS are channeling warm green hills and the soft, gold light of a California evening. Team conversations alternate between distributed processing, PROC IMSTAT and how many pairs of shorts to pack.

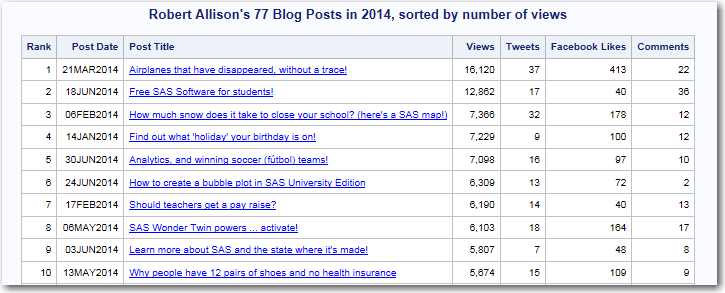
As a blogger, I often wonder whether my blog posts are 'successful' - and being a graph guy, I like to visually analyze the data, to try to answer that question. The most common measure of a blog post is probably the number of times it was viewed, so I guess

Is this blog post about techniques to use on difficult graph legends, or is it about goats? The answer is both! But first, to get you into the proper mood, here is a picture my friend, Mark, took of some cute goats. And some links to YouTube videos about goats


