SAS Learning Post
Technical tips and tricks from SAS instructors, authors and other SAS experts.
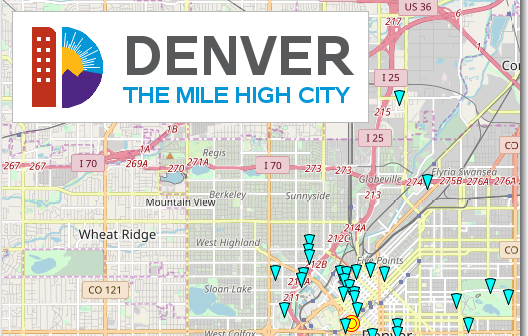
Are you going to Denver, Colorado, and wondering what fun/interesting/eclectic things you can do there? Then this is the map for you! For the past couple of years, I've made maps of the city SAS Global Forum is in, pointing out some of the attractions that conference attendees might want

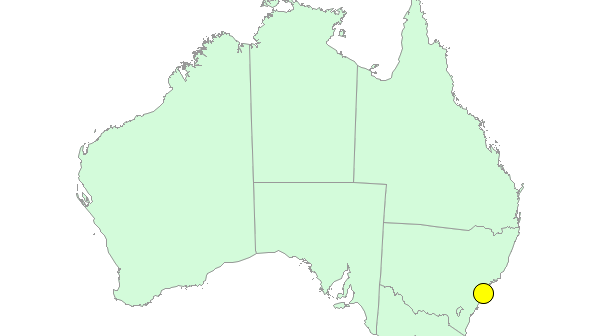
Do you procrastinate and find excuses to delay doing certain things, even when you know they really ought to be done? And you probably realize that starting those projects is usually the hardest part, eh? Well, I finally started converting hundreds of my SAS examples to use the new GfK maps,

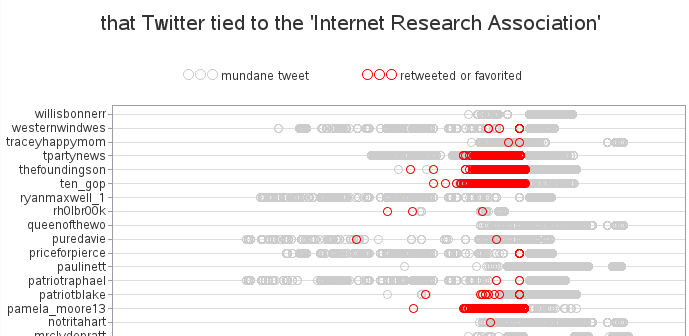
Unless you live under a rock, you've probably seen news reports that Russian trolls have been posting on social media to allegedly conduct "what they called information warfare against the United States, with the stated goal of spreading distrust toward the candidates and the political system in general," according to
