SAS Learning Post
Technical tips and tricks from SAS instructors, authors and other SAS experts.
You've seen the QR codes that you can just scan in with your smartphone's camera, rather than writing down a web URL or other information, right? But do you know how to create your own QR code? Here's an easy way to create them, using SAS... You're probably familiar with

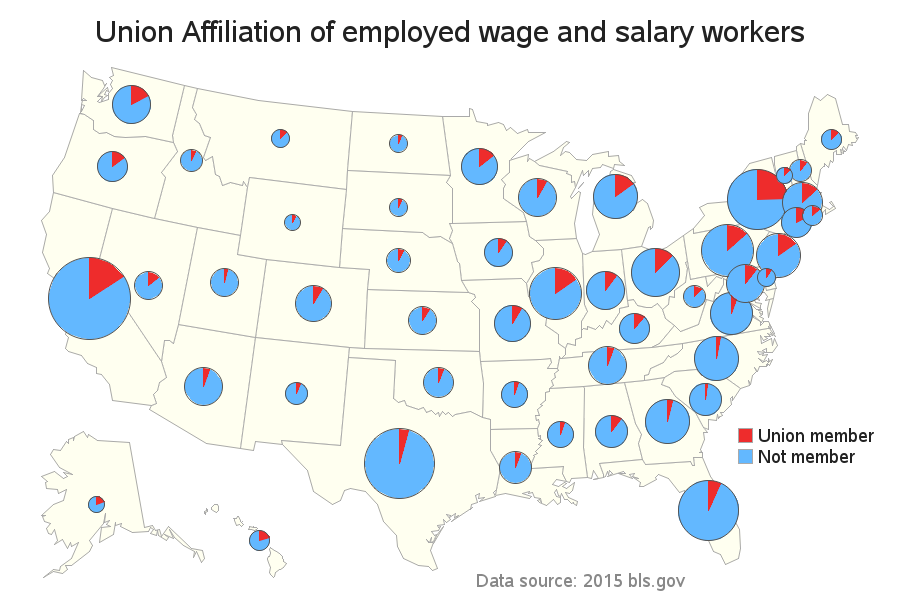
In the past, a large percentage of US workers have been union members, and the unions could exert a big influence on elections. How powerful are the unions these days, an where do they wield the most influence? Let's map it out... In 1954, almost 35% of US workers belonged to

Analytics experts and decision makers are taking over Las Vegas Sept. 12-14 while attending Analytics Experience. Whether you are in Vegas or need to participate from the luxury of your sofa or office, read on for help to stay connected and be a part of it all. Watch Live There

