SAS Learning Post
Technical tips and tricks from SAS instructors, authors and other SAS experts.
Data science may be a difficult term to define, but data scientists are definitely in great demand! Wayne Thompson, Senior Product Manager at SAS, defines data science as a broad field that entails applying domain knowledge and machine learning to extract insights from complex and often dark data. To further

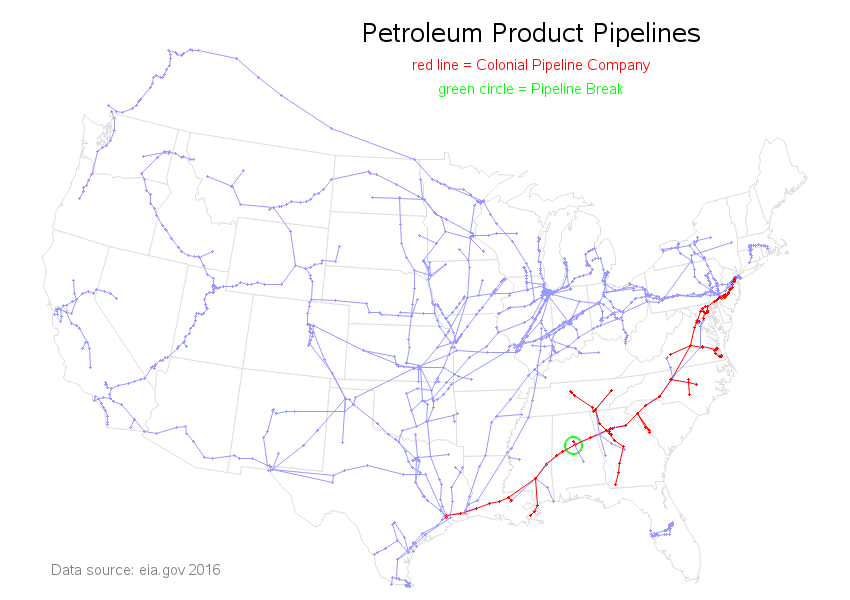
Last week, one of the major pipelines supplying gasoline to the eastern US broke. Do you know where the break is, and which states will be having shortages? Me neither! ... So, of course, I created a SAS map to help... First I read up about the spill on various

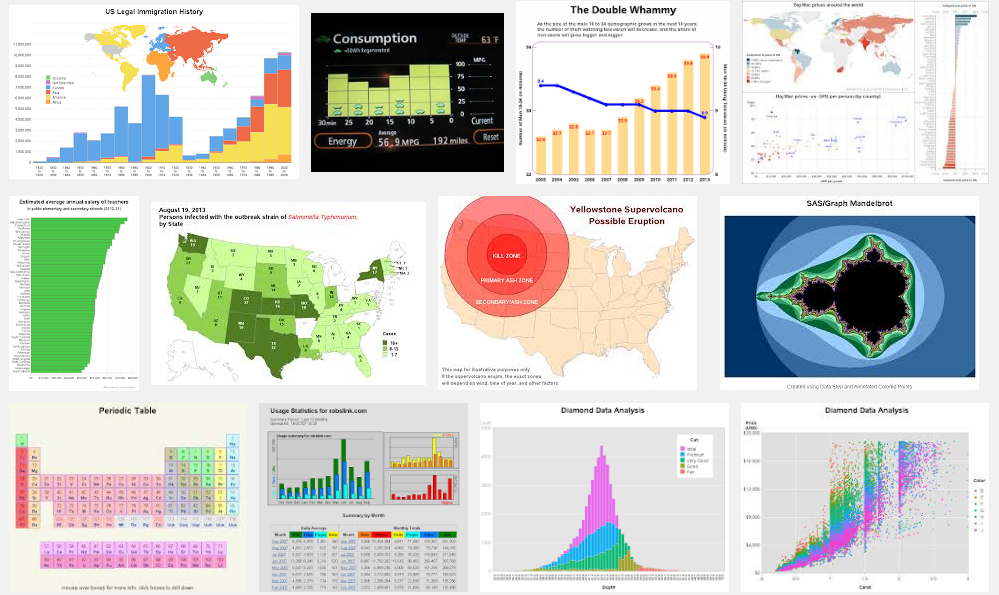
I've created several hundred SAS graphs over the years. I was just musing to myself this morning how nicely Google lets me peruse through images of my graphs. And I thought some of you might also like to know how to do that... Most of you know how to search for keywords

