Several years ago, my husband and I were remodeling our first house together. We decided we wanted to have cable television upstairs. Being young, foolish and lacking in disposable income, we decided to do it ourselves. My husband said he would run the cable through the attic and drop it
Uncategorized

PROC STP is a new procedure for SAS 9.3 Stored Processes. It's so new and different that I have not had the opportunity to use it yet in a customer engagement. When writing about it for the now released "The 50 Keys to Learning SAS Stored Processes" book, I had
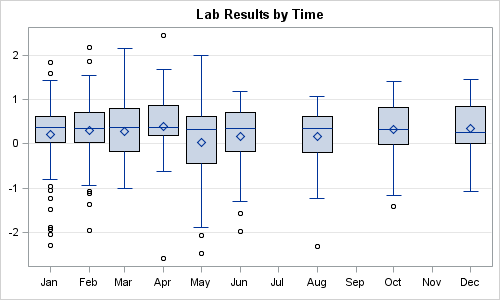
ODS Graphics have matured. With SAS 9.2, GTL and SG procedures were a new direction for creating analytical graphs in SAS. The motivation and design of the GTL framework and the SG procedures was driven primarily by the needs of the procedure writers within SAS to enable the automatic creation
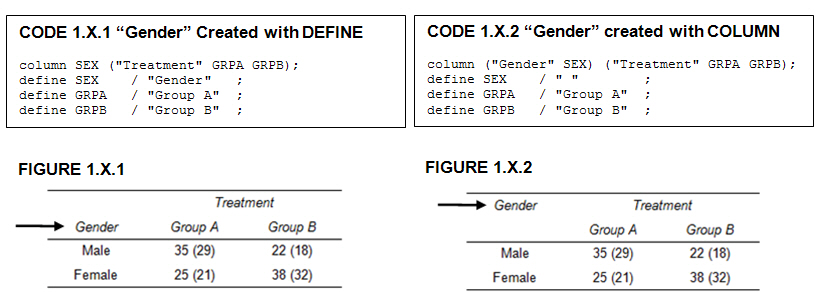
I’m a SAS user in the Pharmaceutical industry. I switched to the Pharmaceutical industry (from Marketing Research) four years ago and had a lot to learn! I started my new endeavor by purchasing some excellent SAS books, joining my local SAS user group, attending conferences (Michigan SAS User Group, PharmaSUG,

On the 10th of April, 1912, the RMS Titanic set out on its maiden voyage across the Atlantic Ocean carrying 2,223 passengers. On the 14th of April, it hit an iceberg and sank. There were 1,517 fatalities. Identifying information was not available for all passengers. The titanic dataset describes the survival status
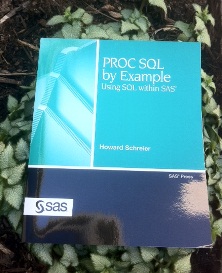
The first line of this week's SAS tip grabs your attention, "PROC SQL provides a helpful (though potentially dangerous) tool in the form of the DESCRIBE TABLE statement." SAS author, consultant, and member of the SAS-L Hall of Fame Howard Schreier included this intriguing statement in his book PROC SQL by Example: Using
With the publication of JSL Companion: Applications of the JMP Scripting Language, by Theresa Utlaut, Georgia Morgan, and Kevin Anderson, novice scripters now have a resource that helps them go beyond the basics of the JMP Scripting Language (JSL). Why JSL? The authors have the answers: 1. Easy to start

Did that set off a trigger for you? It did for my SAS SQL 1: Essentials class, packed with SQL and SAS programmers alike. To clarify matters I pulled up some examples to help get the differences quickly. Set operators and Joins are similar in that they both combine multiple
This morning I had to send my watch off to Switzerland to have its guts replaced. I will be late to everything for the next two weeks. So it was timely that when I got to work, my inbox had the following question from a former student in the Mixed Models
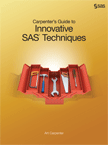
Art Carpenter’s newest book, Carpenter’s Guide to Innovative SAS Techniques, offers advanced SAS programmers an all-in-one programming reference that includes advanced topics not easily found outside the depths of SAS documentation or more advanced training classes. No matter how you approach the use of SAS software, the techniques provided in


