 My previous blog demonstrated the most difficult type of ESTIMATE statement to write—a two-way (or higher) ANOVA with interactions. An "easy button" for ESTIMATE statement comes by having a simpler model.
Models with only main effects and no interactions make writing ESTIMATE statements straightforward. Consider first a one-way ANOVA. A study was conducted at the University of Melbourne[1] exploring the pain thresholds of blonds and brunettes. Subjects were divided into four categories according to hair color: light blond, dark blond, light brunette, and dark brunette. Each person in the experiment was given a pain threshold score based on performance in a pain sensitivity test (the higher the score, the higher the person’s pain tolerance). The variables on the data set are the outcome variable Pain and the four-level predictor variable HairColor.
The code for the ANOVA using PROC GLM would be:
proc glm data=pain; class HairColor; model Pain=HairColor; run; |
The ANOVA table indicates that the pain scores aren't the same for all hair colors.
| Source | DF | Type III SS | Mean Square | F Value | Pr > F |
| HairColor | 3 | 1360.72631 | 453.575439 | 6.79 | 0.0041 |
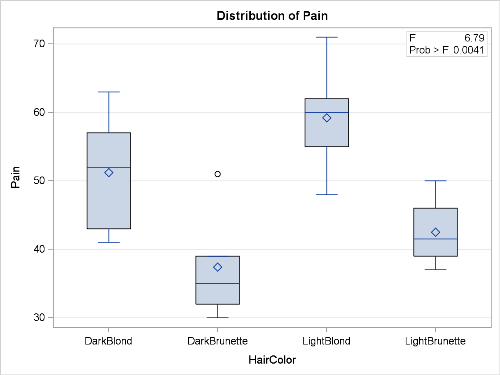
While the boxplots (default output for PROC GLM in SAS 9.3) allow you to visualize the differences, the only way to ascertain whether differences are significant is to use an ESTIMATE (or CONTRAST) statement.
Perhaps you would like to compare average pain scores of blondes and brunettes. You can obtain the coefficients easily by examining the Class Level Information table. First, notice that the levels of HairColor are sorted alphanumerically—DarkBlond, DarkBrunette, LightBlond, and LightBrunette. This will be important in correctly placing the coefficients.
| Class Level Information | ||
| Class | Levels | Values |
| HairColor | 4 | DarkBlond DarkBrunette LightBlond LightBrunette |
You would average the pain scores for dark and light blondes by applying coefficients of 0.5 to those levels (1st and 3rd); then compare that to the average pain scores of dark and light brunettes by applying coefficients of -0.5 to those levels (2nd and 4th). The coefficients should be applied left to right to the four levels of HairColor, as shown in the Values column, resulting in: 0.5, -0.5, 0.5, -and 0.5.
The syntax would then be:
proc glm data=pain; class HairColor; model Pain= HairColor; estimate 'Compare Blondes to Brunettes' HairColor 0.5 -0.5 0.5 -0.5; run; |
The results that follow indicate that blondes have higher pain thresholds than brunettes by 15.25 points, on average.
| Parameter |
Estimate |
Standard Error |
t Value |
Pr > |t| |
| Compare Blondes to Brunettes |
15.250000 |
3.7672492 |
4.05 |
0.0011 |
While this ESTIMATE statement comes from a one-way ANOVA, the approach will be the same for ANOVA models with more than one factor, as long as no interactions are present.
In the next blog, we'll look at the EASIEST of all ESTIMATE statements—continuous variables not involved in interactions or higher order terms. Until then, enjoy your new "easy button"! (To learn more, take our Statistics 2: ANOVA and Regression training course.)
[1] From the OzDasl website