I am passionate about teaching. My colleagues would probably say this is the understatement of the year. And it likely has something to do with the fact that both of my parents were teachers. I started my teaching career at the university level and after many years an unexpected opportunity
Uncategorized
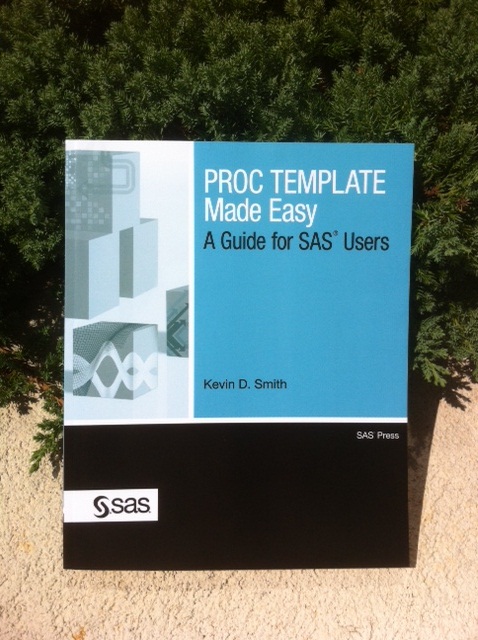
This week's SAS tip is from Kevin D. Smith and his new book PROC TEMPLATE Made Easy: A Guide for SAS Users. Kevin is a software developer at SAS with extensive experience supporting PROC TEMPLATE and underlying ODS technologies. We're excited that Kevin decided to write his book and hope
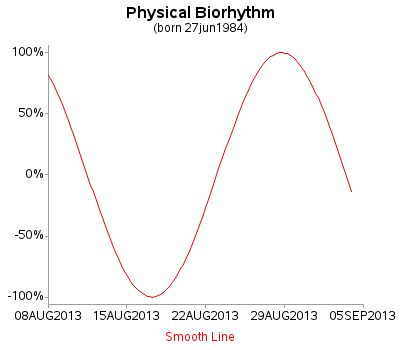
Do you know (right off the top of your head) the simple SAS/GRAPH code you would use to create line graphs? ... If not, then this tutorial is for you! A line plot is basically a scatter plot where the markers are connected. A line plot should only be used
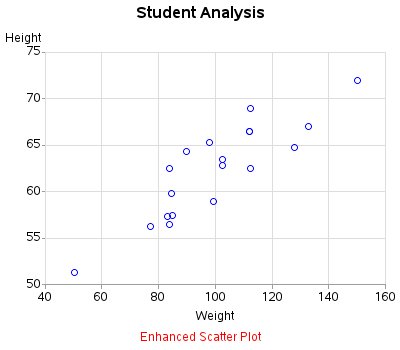
Scatter plots are probably the simplest kind of graph, and provide a great way to visually look for relationships between two variables. But, do you know (right off the top of your head) the simple SAS/GRAPH code you would use to create them? ... This tutorial leads you step-by-step through the
With the pervasiveness of mobile devices, being able to read while “on the go” has been easier than ever. How many times have you found yourself in a situation where you pass the time waiting by reading something on your phone/iPad/tablet etc? With eBooks on my iPad, I find that
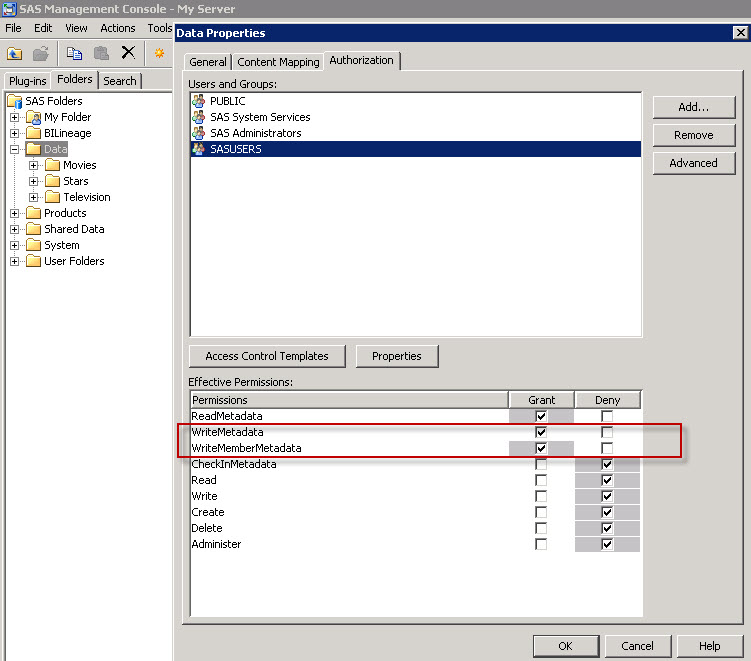
From an Enterprise Guide user's perspective, a SAS library is a library. Whether it was defined in the autoexec or in the metadata or by magic, it is there for them to use with no issues. However, there is a difference as metadata defined libraries do not behave in the
We’ve just published Decision Trees for Analytics Using SAS Enterprise Miner by Barry de Ville and Padraic Neville. Filled with many figures and examples, this comprehensive book has garnered strong early user reviews. We invited the authors to share a few words about their new book. Neville had this to
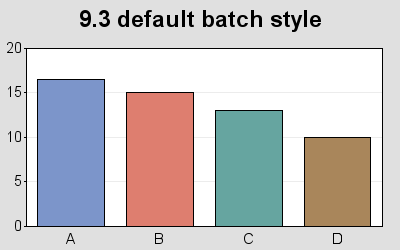
ODS graph styles provide users with an easy way to control things such as the colors and fonts used in a graph, freeing the user from having to specify these properties in their code. A lot of thought was given to picking colors that work well together, and look good. The
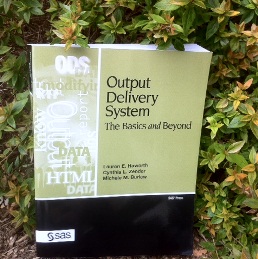
This week's SAS tip is from Lauren Haworth, Cynthia L. Zender, and Michele Burlew's book Output Delivery System: The Basics and Beyond. This example-driven book includes broad coverage of some of the best features of ODS. To learn more about the book and the authors, visit our Web catalog to read
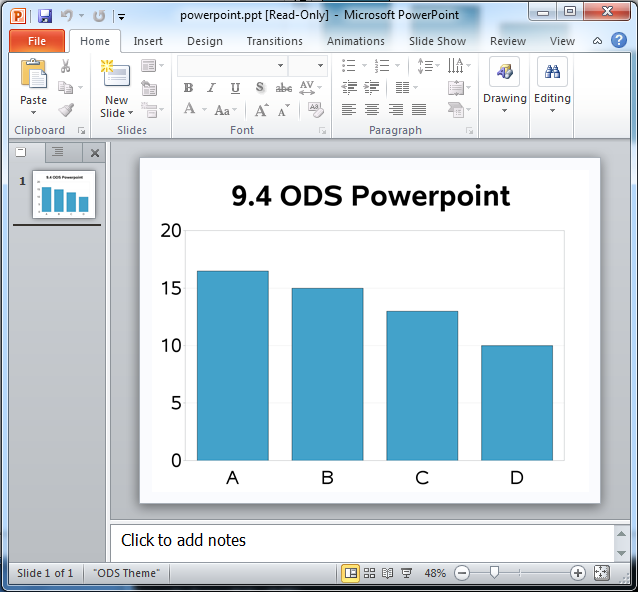
To say that I'm excited about the SAS 9.4 release is an understatement! For example, did you know that in SAS 9.4, you can write SAS/Graph output directly to a Powerpoint slide?!? This is definitely an item that was on my "wish list," and will no doubt make life a


