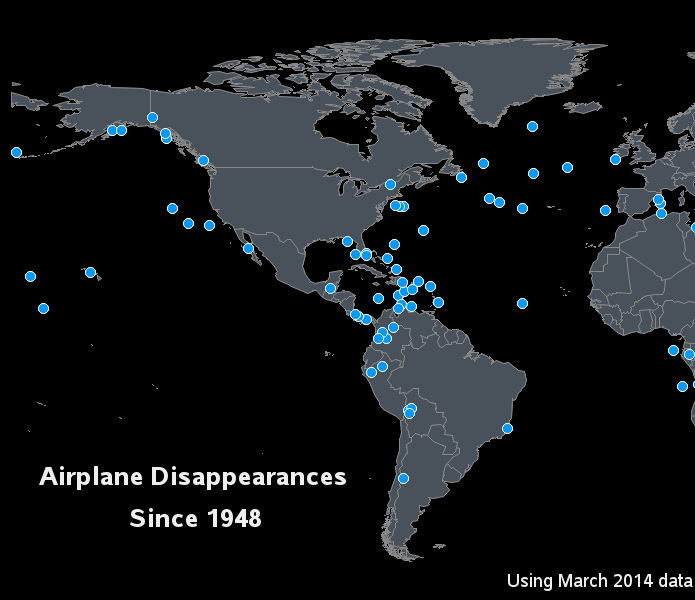
SAS is great at helping make important business decisions - how about helping decide where to take your next vacation?... Here's a picture from one of my favorite vacations with my buddy Joe. As you can see, I like "nature vacations." Can you guess where this one was? (leave a comment with
Uncategorized
This week’s author tip is from Matthew Gillingham and his new book SAS Programming with Medicare Administrative Data. Gillingham has been programming in SAS for 15 years and has spent 10 of those years specifically dealing with health care use, cost and quality measurement. Here’s Gillingham’s tip for you: To
Order must be the most frequent cry for help in the SAS classroom. “HELP,” said my student in the classroom. “I work with messy health data. My users want to see data in this order.” T1.col1, t1.col2, t1.col3, t1.col4, t2.col5, t1.col6 and list the remaining columns in column position from
I bet a lot of SAS users know where the phrase "Live Long and Prosper" comes from ... but can we use SAS software to also help analyze 'how long'? This blog posting shows several different kinds of SAS graphs that can help answer such a question! Let's start with
The SAS author’s tip of the week blogs are back! Sorry for the short break - I’ve been working to transition into my new role as editor of the SAS Bookshelf. We will continue to feature these helpful tips for our readers. Please let me know if there is any
Go USA! Go Germany! Go Mexico! Go Colombia! Wish you were still in it, England! That’s right, it’s World Cup time, and due to the international flavor of my family, I’ve got a number of teams I’m rooting for. I played a little soccer (or “futbol” in our house) back
SAS software can be used for many things - here's how you could use it to help save endangered sea turtles! You've seen SAS used to track endangered wildlife by the shape of their footprints, and help run Texas Parks & Wildlife. Now, how about tracking the movements of (and thereby helping
When teaching statistics, it is often useful to produce a normal density plot with shading under the curve. For example, consider a one-sided hypothesis test. An alpha value of .05 would correspond to a Z-score cutoff of 1.645. This means that 95% of a standard normal curve falls below a
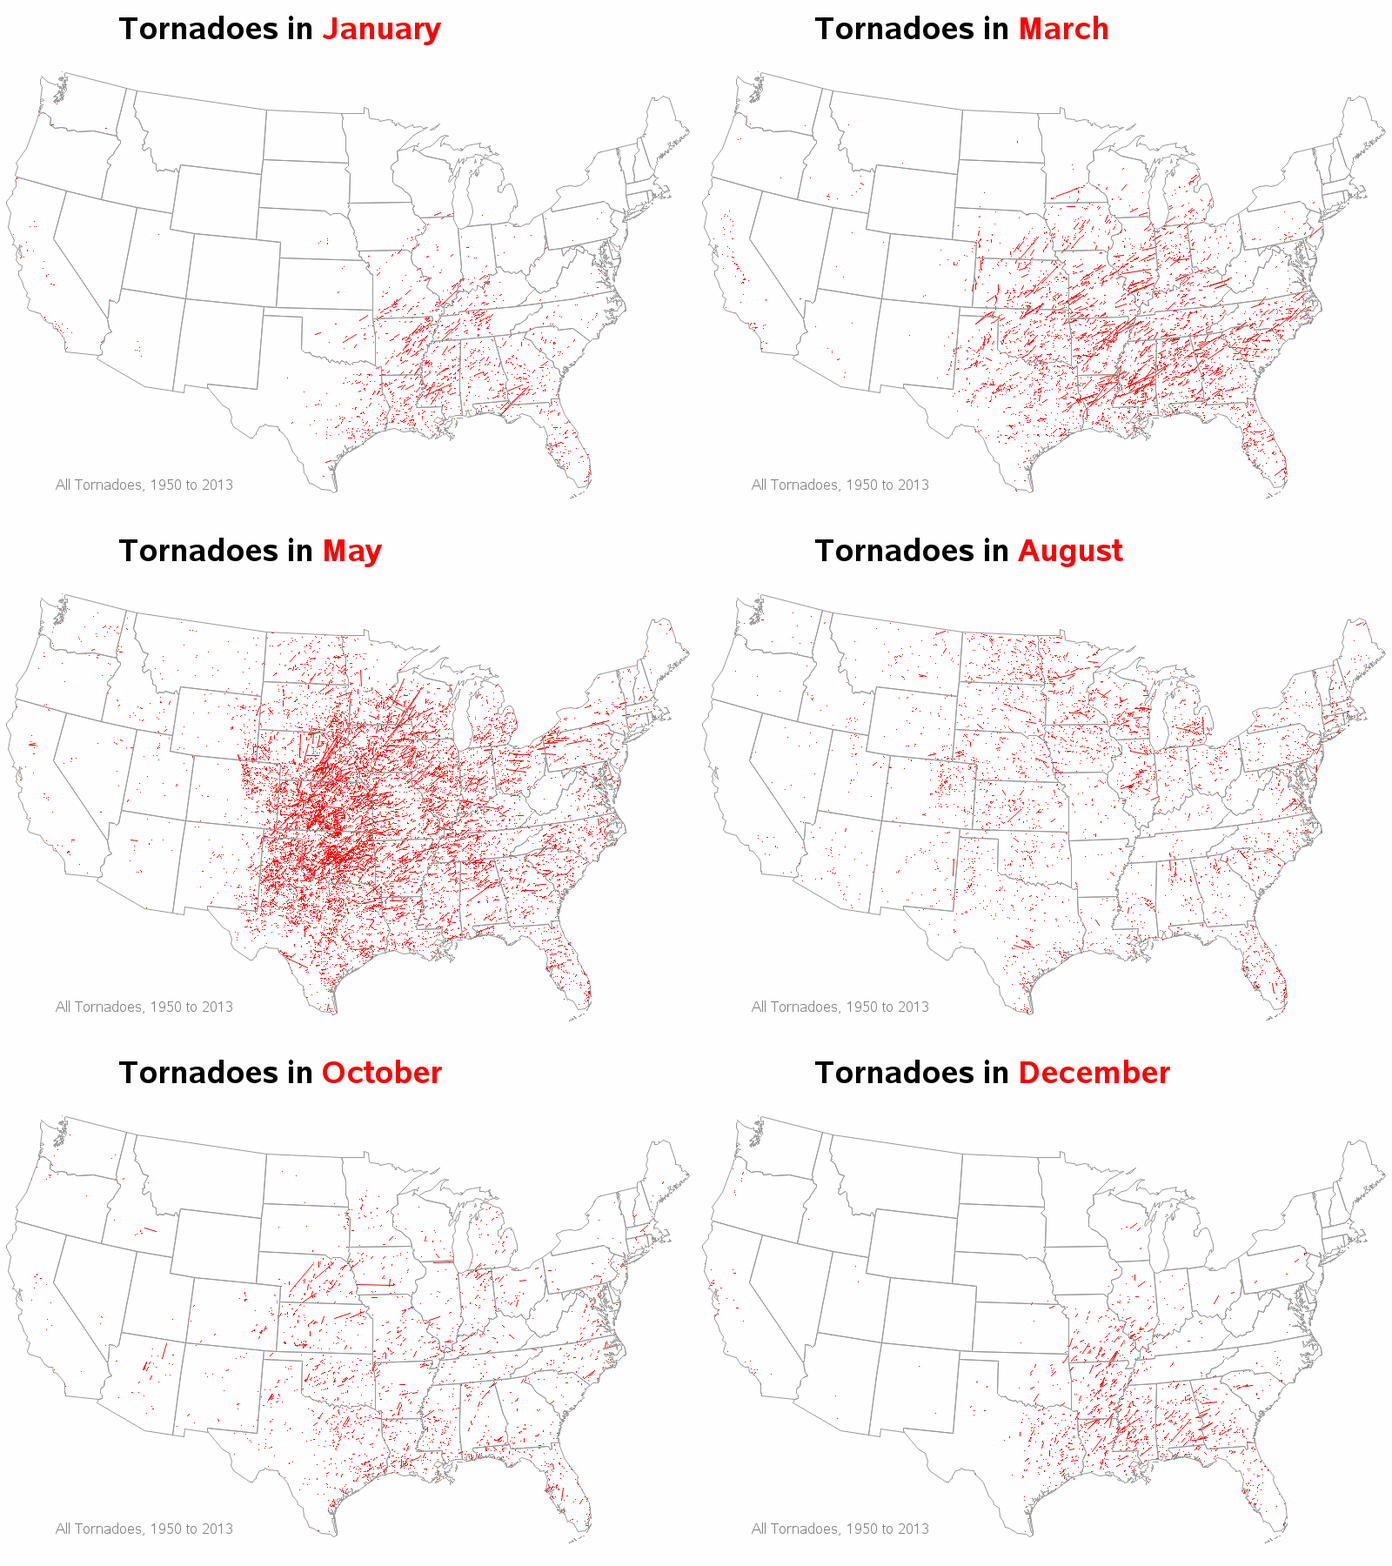
This blog post describes a neat example of some cool SAS capabilities, and also teaches you a little more about the state where SAS software is made... Here at the SAS headquarters in Cary, NC, the main TV news channel is WRAL TV5. And my favorite segment during the news is Scott
We all know the importance of understanding the data you are working with. After all, the best programmers we know have combined their lifelong pursuit of programming knowledge with a similar pursuit of some specific subject matter. I have programmed in SAS for about 15 years and have pursued expertise