Have you been using the SAS/Graph Gmap procedure to plot your data on maps for years, but never knew you could add roads to your maps?!? Follow along in this blog post, and I'll teach you how... But before we get started, here's a picture of a nice aerial view
Uncategorized
Editor's note: This series of blogs addresses the questions we are most frequently asked at SAS Press! In our last post about how to write a good outline, we discussed the importance of developing an outline for your proposed SAS Press book and gave some tips on how to do
What?!? You mean a period (.) isn't the only SAS numeric missing value? Well, there are 27 others: .A .B, to .Z and ._ (period underscore). Your first question might be: "Why would you need more than one missing value?" One situation where multiple missing values are useful involves survey data. Suppose
Are your friends passing around clever memes (supposedly) featuring something your favorite actor said, or sharing news articles that you think might be "fake news"? If there's even a hint of data analyst in you, then you probably check the actual data, and confirm or disprove the supposed facts yourself. I
When mentioning to friends that I’m going to Orlando for SAS Global Forum 2107, they asked if I would be taking my kids. Clearly my friends have not attended a SAS Global Forum before as there have been years where I never even left the hotel! My kids would NOT enjoy it… but,
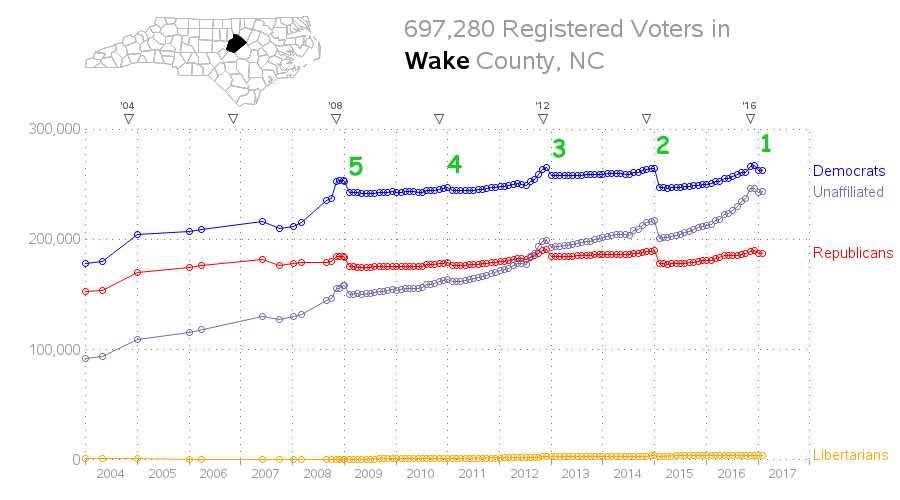
After the recent presidential election, I was updating my graphs of the voter registration data and noticed that the number of registered voters decreased after the election. At first I thought that was odd, but then I realized that maybe inactive voters were being purged. I wanted to find out
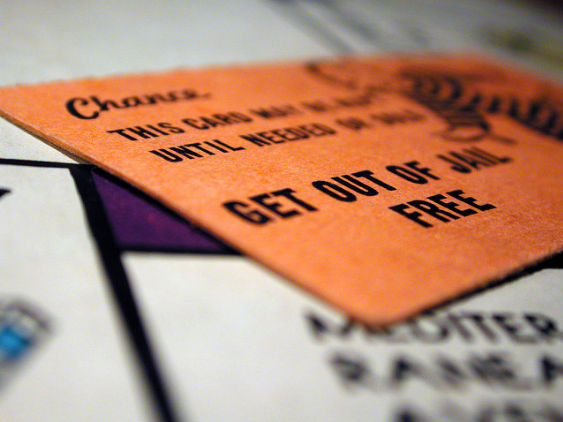
A topic that's been in the news a lot lately is the presidential power to grant pardons, commutations, and such. But all the articles I've seen just quoted numeric totals - I haven't seen a graph of the data anywhere! So I set out to find the data and graph
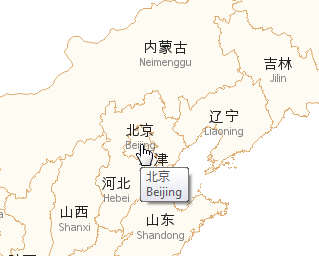
Doing business in a global economy, have you ever found yourself wanting to show Chinese (or Korean, or Japanese) labels on a map? If so, then this blog is for you! Before we get started, here is a photo of some Chinese characters to get you into the mood. This
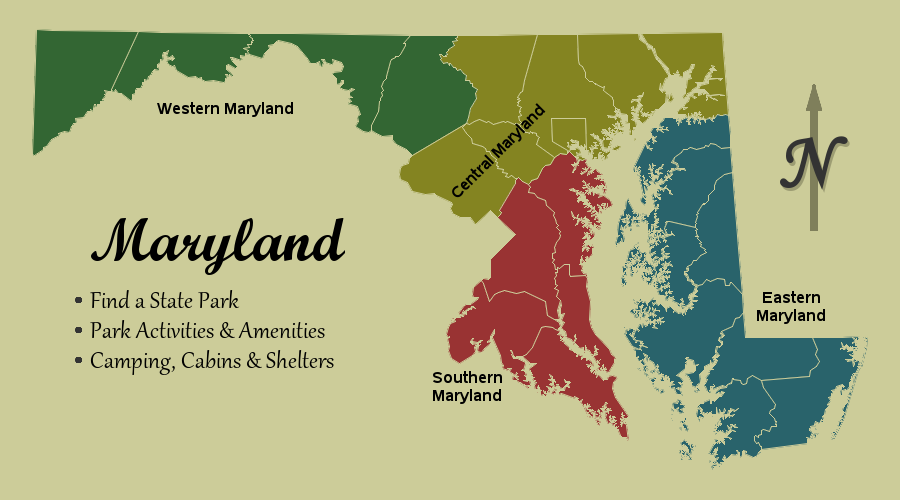
I usually create very technical maps, to display data spatially - and they usually have a certain look. They're clear, crisp, and to the point. I typically only use color to represent the data, and I choose a font that is simple and easy to read (such as arial). But
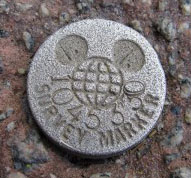
Are you one of those people who get easily bored at amusement parks? Would you like something to do while your friends/family are waiting in line for a ride? Perhaps I have an alternate idea, to keep you busy - survey markers! When surveyors are measuring and marking areas for