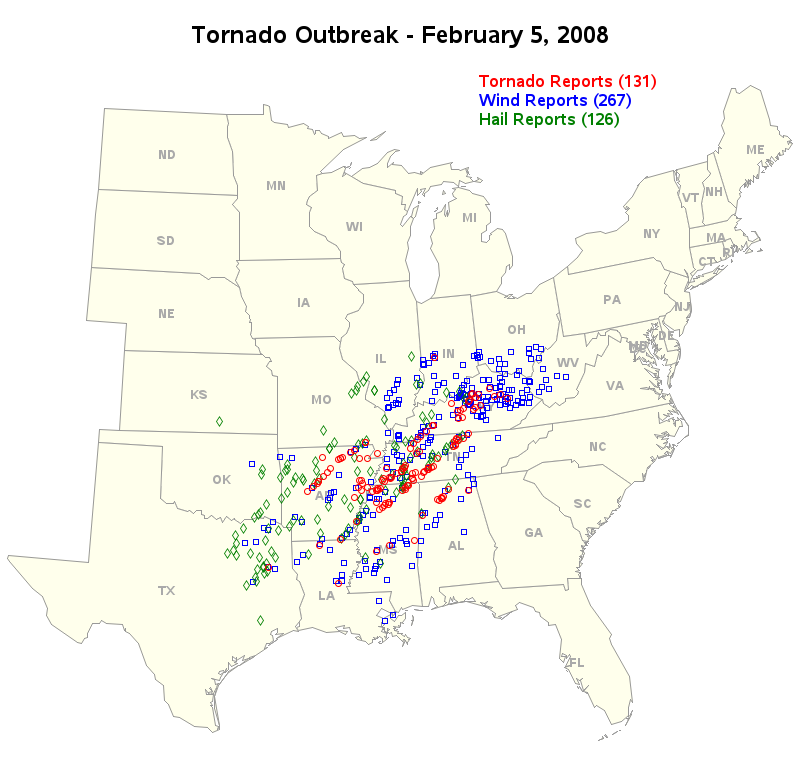
Last night, here in the U.S., an outbreak of deadly tornadoes tore across several states. Unfortunately, nobody knows how to predict a tornado with certainty, but let's brainstorm on how SAS Software can help analyze the data in the aftermath of a natural disaster like this... Being a graph guy, the first
Author
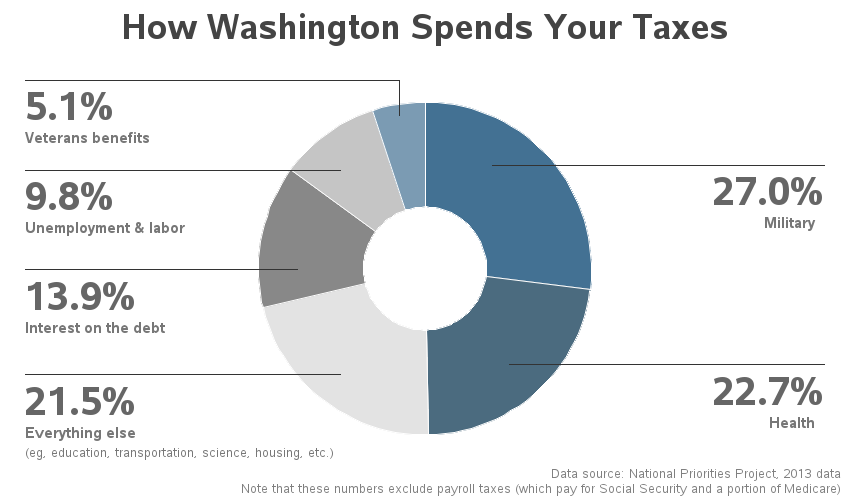
As I was doing my taxes, I wondered where the government is spending my tax dollars. And being a SAS user, I decided to find out using a graph ... I did a few Google searches on "tax graphs" and found one on the CNN web site that I liked - it
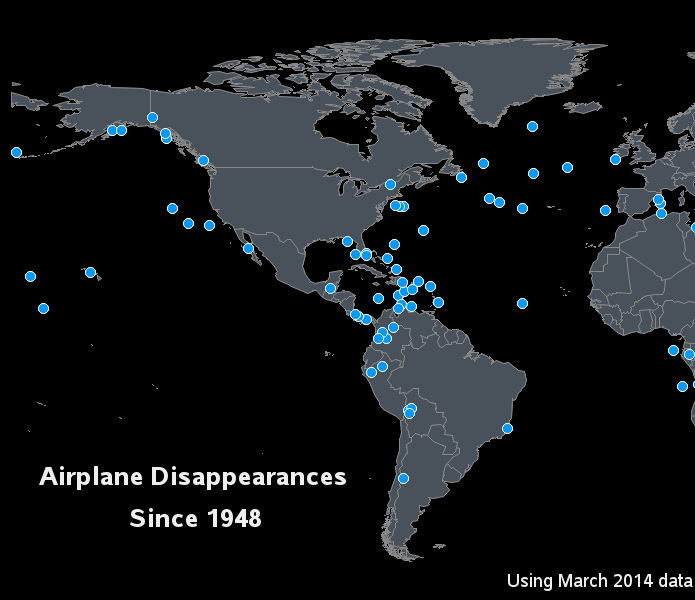
With all the recent news reports about the missing Flight 370, I wondered what other airplanes have disappeared without a trace ... and I used SAS to visualize that data! There was in interesting infographic on the Bloomberg website that sort of answered my question, but their map just had
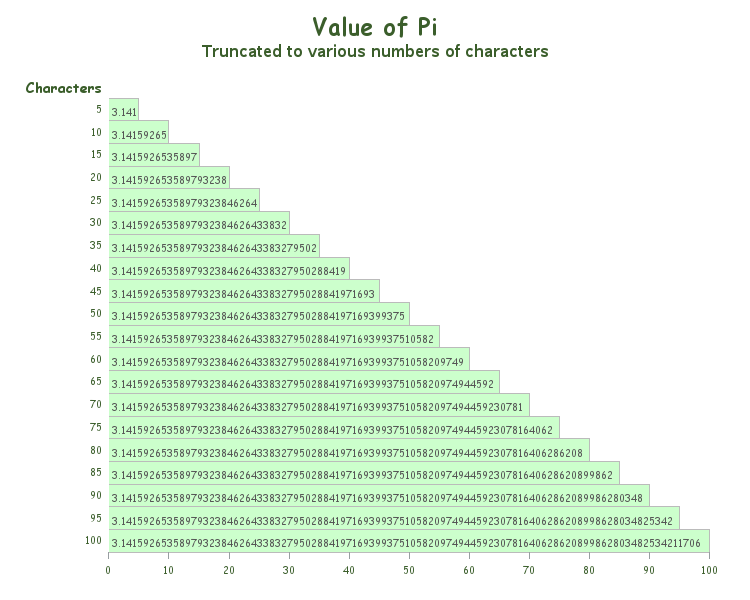
Did you know that this Friday is Pi Day? How are you planning to commemorate this special day? :) Next year's Pi Day might even be more special than usual, being that it will contain: March 14, 2015 - 9:26:53. And if you realize the coolness of that (3.141592653), you might be
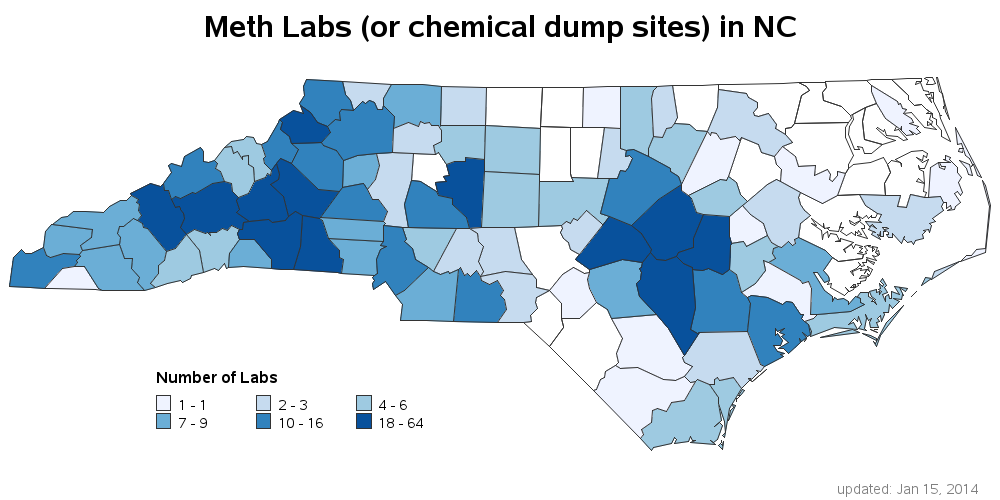
In the Breaking Bad TV series, Walter White has an impressive lab where he secretly makes the illegal drug methamphetamine (meth). Wouldn't it be cool to use SAS to show the locations of all the clandestine meth labs in the US?!? Let's do it!... In this blog, I show you
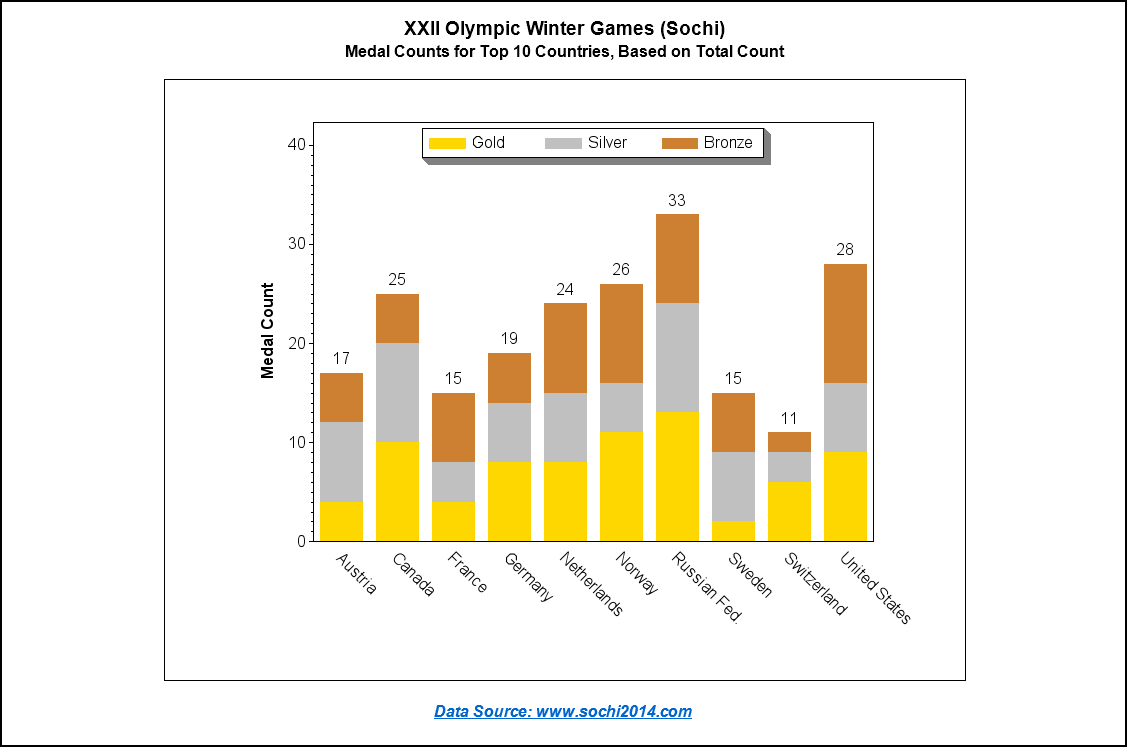
Michele Ensor recently posted a wonderful blog with a graph of the 2014 Winter Olympics medal count. I'm going to further refine that graph, making it an Olympic graph ... on steroids! :) Here is Michele's graph: First, let's give it a few simple cosmetic changes. I always like to have
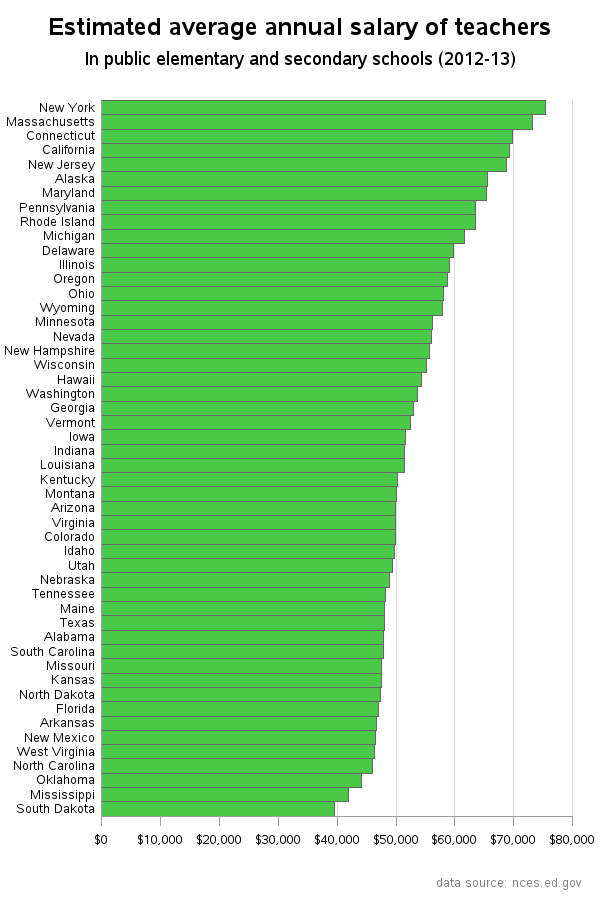
Teacher pay, and the possibility of a raise, has been a hot topic in North Carolina lately. So I decided to look around and see if I could find any good data related to teacher salary, and then try to determine the best way to present that data graphically. I found that
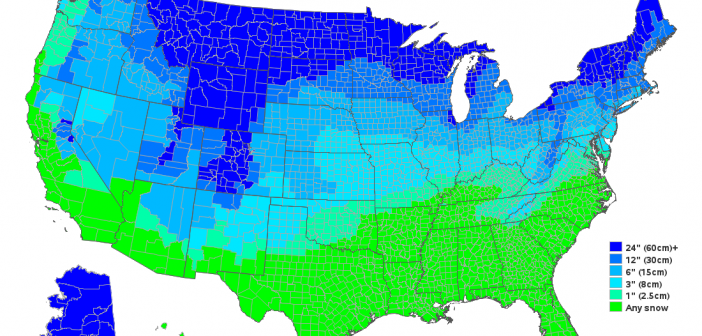
We get very little snow in Wake County, NC (SAS Headquarters) - therefore when we do have snow, it's a big deal and they close the schools. Which made me wonder ... how much snow does it take to close schools in the rest of the US? Last week we got our
In a previous post, I showed you how to send graphs with charttips & drilldowns in an email ... but what if you also need to send the graphs that you're drilling-down to? You guessed it - SAS also has a slick trick for doing that! When you create SAS graphs
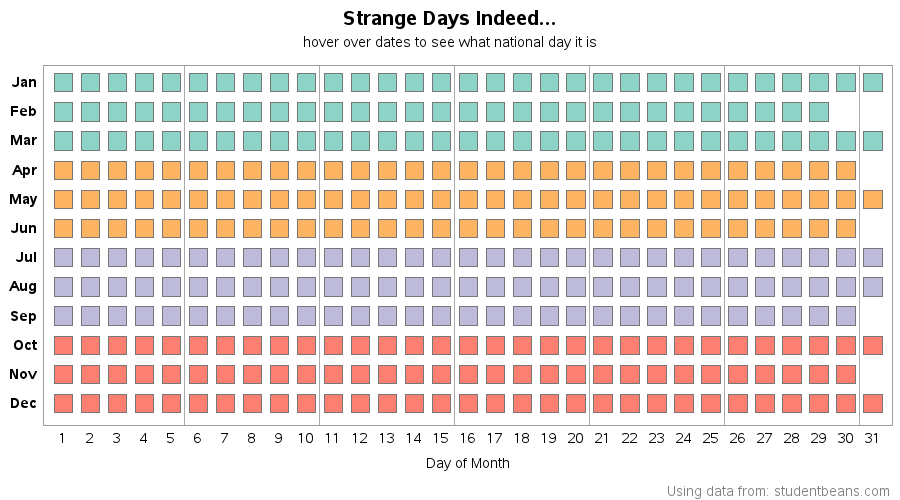
Every day of the year is an official 'national day' for something - here's a SAS chart to help you find which bizarre 'national day' falls on your birthday! I recently read an article that lists weird and unconventional national days. It was very interesting, but I found the data